Estimated Value: $341,000 - $534,000
4
Beds
3
Baths
1,642
Sq Ft
$274/Sq Ft
Est. Value
About This Home
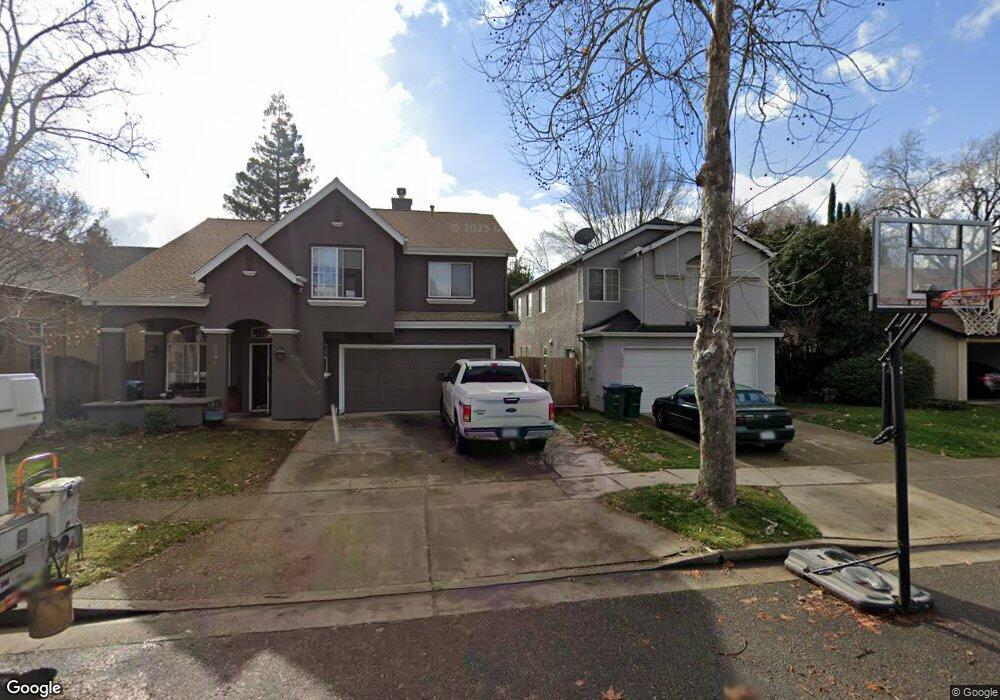
This home is located at 1977 Bending Oak Way, Chico, CA 95928 and is currently estimated at $449,773, approximately $273 per square foot. 1977 Bending Oak Way is a home located in Butte County with nearby schools including Little Chico Creek Elementary School, Harry M. Marsh Junior High School, and Chico High School.
Ownership History
Date
Name
Owned For
Owner Type
Purchase Details
Closed on
Feb 11, 2002
Sold by
Hewlett Thomas M and Hewlett Carol Ann
Bought by
Hewlett Thomas M and Hewlett Carol A
Current Estimated Value
Purchase Details
Closed on
Apr 27, 2001
Sold by
Casavantes G Reva I
Bought by
Prudential Residential Svcs Ltd Prtnrshp
Home Financials for this Owner
Home Financials are based on the most recent Mortgage that was taken out on this home.
Original Mortgage
$18,200
Interest Rate
7.21%
Mortgage Type
Stand Alone Second
Purchase Details
Closed on
Apr 26, 2001
Sold by
Prudential Residential Svcs Ltd Prtnrshp
Bought by
Hewlett Thomas M and Hewlett Carol Ann
Home Financials for this Owner
Home Financials are based on the most recent Mortgage that was taken out on this home.
Original Mortgage
$18,200
Interest Rate
7.21%
Mortgage Type
Stand Alone Second
Create a Home Valuation Report for This Property
The Home Valuation Report is an in-depth analysis detailing your home's value as well as a comparison with similar homes in the area
Purchase History
| Date | Buyer | Sale Price | Title Company |
|---|---|---|---|
| Hewlett Thomas M | -- | -- | |
| Prudential Residential Svcs Ltd Prtnrshp | -- | Mid Valley Title | |
| Hewlett Thomas M | $182,000 | Mid Valley Title |
Source: Public Records
Mortgage History
| Date | Status | Borrower | Loan Amount |
|---|---|---|---|
| Previous Owner | Prudential Residential Svcs Ltd Prtnrshp | $18,200 | |
| Previous Owner | Hewlett Thomas M | $145,600 |
Source: Public Records
Tax History
| Year | Tax Paid | Tax Assessment Tax Assessment Total Assessment is a certain percentage of the fair market value that is determined by local assessors to be the total taxable value of land and additions on the property. | Land | Improvement |
|---|---|---|---|---|
| 2025 | $3,226 | $274,218 | $97,932 | $176,286 |
| 2024 | $3,226 | $268,842 | $96,012 | $172,830 |
| 2023 | $3,157 | $263,572 | $94,130 | $169,442 |
| 2022 | $3,126 | $258,405 | $92,285 | $166,120 |
| 2021 | $3,053 | $253,339 | $90,476 | $162,863 |
| 2020 | $3,040 | $250,743 | $89,549 | $161,194 |
| 2019 | $2,986 | $245,828 | $87,794 | $158,034 |
| 2018 | $2,921 | $241,009 | $86,073 | $154,936 |
| 2017 | $2,870 | $236,285 | $84,386 | $151,899 |
| 2016 | $2,671 | $231,653 | $82,732 | $148,921 |
| 2015 | $2,657 | $228,175 | $81,490 | $146,685 |
| 2014 | $2,614 | $223,706 | $79,894 | $143,812 |
Source: Public Records
Map
Nearby Homes
- 1991 Humboldt Rd
- 2055 Amanda Way Unit 26
- 2050 Springfield Dr Unit 101
- 2050 Springfield Dr Unit 212
- 974 Wisconsin St
- 1368 E 9th St
- 18 Morning Rose Way
- 1802 Notre Dame Blvd
- 1169 E 9th St
- 825 El Monte Ave
- 1022 Linden St
- 1 Parkhurst St
- 1077 E 8th St
- 656 Jardin Way
- 573 E 19th St
- 1274 Filbert Ave
- 2215 Laurel St
- 2085 Mulberry St
- 5 Nancy Ln
- 0 Fair St Unit SN25230897
- 1981 Bending Oak Way
- 1973 Bending Oak Way
- 1985 Bending Oak Way
- 1969 Bending Oak Way
- 16 Christopher Alan Ln
- 18 Christopher Alan Ln
- 14 Christopher Alan Ln
- 1989 Bending Oak Way
- 20 Christopher Alan Ln
- 1 Heartwood Ct
- 1503 Ridgebrook Way
- 1505 Ridgebrook Way
- 1993 Bending Oak Way
- 11 Heartwood Ct
- 22 Christopher Alan Ln
- 7 Christopher Alan Ln
- 12 Christopher Alan Ln
- 2 Heartwood Ct
- 9 Christopher Alan Ln
- 1509 Ridgebrook Way Unit 19
Your Personal Tour Guide
Ask me questions while you tour the home.