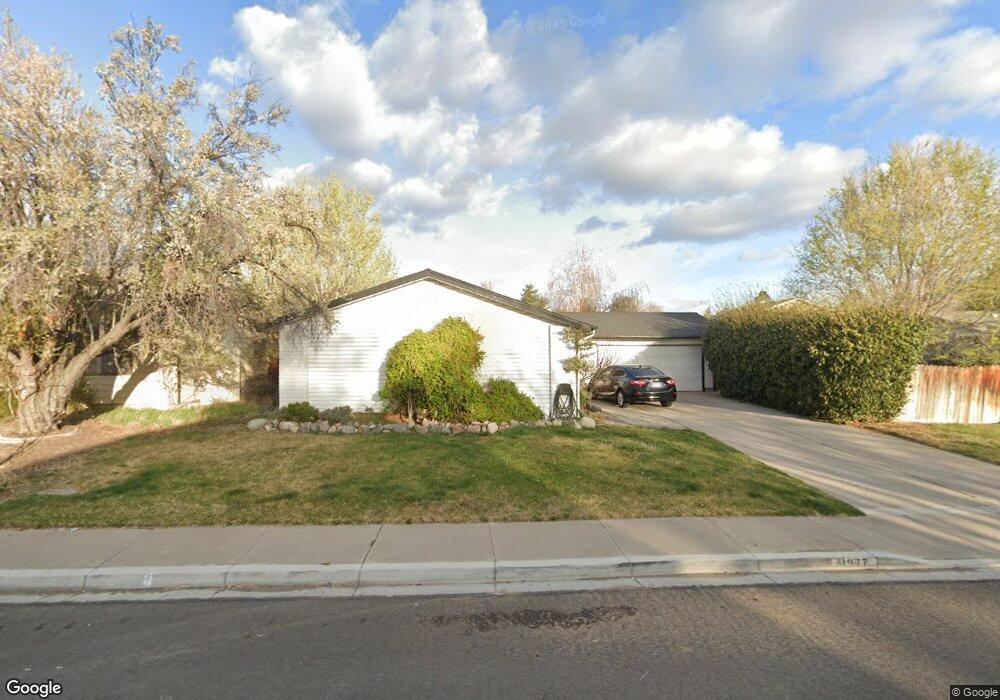
1977 Mesa Vista Dr Unit 6 Sparks, NV 89434
O'Callaghan NeighborhoodEstimated Value: $428,812 - $443,000
3
Beds
2
Baths
1,333
Sq Ft
$326/Sq Ft
Est. Value
About This Home
This home is located at 1977 Mesa Vista Dr Unit 6, Sparks, NV 89434 and is currently estimated at $433,953, approximately $325 per square foot. 1977 Mesa Vista Dr Unit 6 is a home located in Washoe County with nearby schools including Katherine Dunn Elementary School, George L Dilworth Middle School, and Edward C Reed High School.
Ownership History
Date
Name
Owned For
Owner Type
Purchase Details
Closed on
May 23, 2011
Sold by
Cruz Yesenia H
Bought by
Stefan David A and Stefan Marilyn M
Current Estimated Value
Home Financials for this Owner
Home Financials are based on the most recent Mortgage that was taken out on this home.
Original Mortgage
$86,400
Interest Rate
4.48%
Mortgage Type
New Conventional
Purchase Details
Closed on
Jul 21, 2005
Sold by
Cruz Marcos
Bought by
Cruz Yesenia H
Home Financials for this Owner
Home Financials are based on the most recent Mortgage that was taken out on this home.
Original Mortgage
$252,000
Interest Rate
5.56%
Mortgage Type
Fannie Mae Freddie Mac
Purchase Details
Closed on
Jun 1, 2005
Sold by
Hamilton Sarah L
Bought by
Cruz Yesenia H
Home Financials for this Owner
Home Financials are based on the most recent Mortgage that was taken out on this home.
Original Mortgage
$252,000
Interest Rate
5.56%
Mortgage Type
Fannie Mae Freddie Mac
Create a Home Valuation Report for This Property
The Home Valuation Report is an in-depth analysis detailing your home's value as well as a comparison with similar homes in the area
Home Values in the Area
Average Home Value in this Area
Purchase History
| Date | Buyer | Sale Price | Title Company |
|---|---|---|---|
| Stefan David A | $108,000 | First American Title Reno | |
| Cruz Yesenia H | -- | First American Title | |
| Cruz Yesenia H | $280,000 | First American Title |
Source: Public Records
Mortgage History
| Date | Status | Borrower | Loan Amount |
|---|---|---|---|
| Previous Owner | Stefan David A | $86,400 | |
| Previous Owner | Cruz Yesenia H | $252,000 |
Source: Public Records
Tax History Compared to Growth
Tax History
| Year | Tax Paid | Tax Assessment Tax Assessment Total Assessment is a certain percentage of the fair market value that is determined by local assessors to be the total taxable value of land and additions on the property. | Land | Improvement |
|---|---|---|---|---|
| 2025 | $1,370 | $59,228 | $37,275 | $21,953 |
| 2024 | $1,331 | $54,256 | $32,620 | $21,636 |
| 2023 | $918 | $51,712 | $31,710 | $20,002 |
| 2022 | $1,234 | $44,767 | $27,475 | $17,292 |
| 2021 | $1,198 | $38,984 | $21,175 | $17,809 |
| 2020 | $1,161 | $38,928 | $20,510 | $18,418 |
| 2019 | $1,127 | $37,242 | $18,865 | $18,377 |
| 2018 | $1,076 | $31,889 | $13,405 | $18,484 |
| 2017 | $1,032 | $31,420 | $12,810 | $18,610 |
| 2016 | $1,006 | $31,792 | $12,355 | $19,437 |
| 2015 | $1,004 | $29,833 | $9,695 | $20,138 |
| 2014 | $975 | $28,282 | $8,435 | $19,847 |
| 2013 | -- | $25,997 | $6,055 | $19,942 |
Source: Public Records
Map
Nearby Homes
- 1973 Rio Tinto Dr
- 1897 Bonita Vista Dr
- 913 Glen Molly Dr
- 1051 Glen Martin Dr
- 745 Glen Vista Dr
- 1970 Woodhaven Ln
- 1095 E York Way
- 1544 Woodhaven Ln
- 1728 Bluehaven Dr
- 949 Crestwood Dr Unit 3
- 370 O'Brien Way
- 848 Parkside Dr Unit 1
- 1218 Junction Dr
- 1990 Fargo Way
- 857 Cherry Tree Dr Unit 3
- 1128 Bradley Square
- 801 Woodglen Dr Unit 2
- 385 Gleeson Way
- 3071 Meadowlands Dr
- 3167 Bristle Branch Dr
- 1957 Mesa Vista Dr
- 2007 Mesa Vista Dr
- 2054 La Hacienda Dr
- 2004 La Hacienda Dr
- 2074 La Hacienda Dr
- 1927 Mesa Vista Dr
- 1976 Mesa Vista Dr
- 1956 Mesa Vista Dr
- 2017 Mesa Vista Dr
- 1974 La Hacienda Dr
- 2016 Mesa Vista Dr
- 2094 La Hacienda Dr
- 1926 Mesa Vista Dr
- 1887 Mesa Vista Dr Unit 6
- 1934 La Hacienda Dr
- 2037 Mesa Vista Dr
- 2104 La Hacienda Dr
- 1993 La Hacienda Dr
- 860 El Cortez Way
- 1886 Mesa Vista Dr