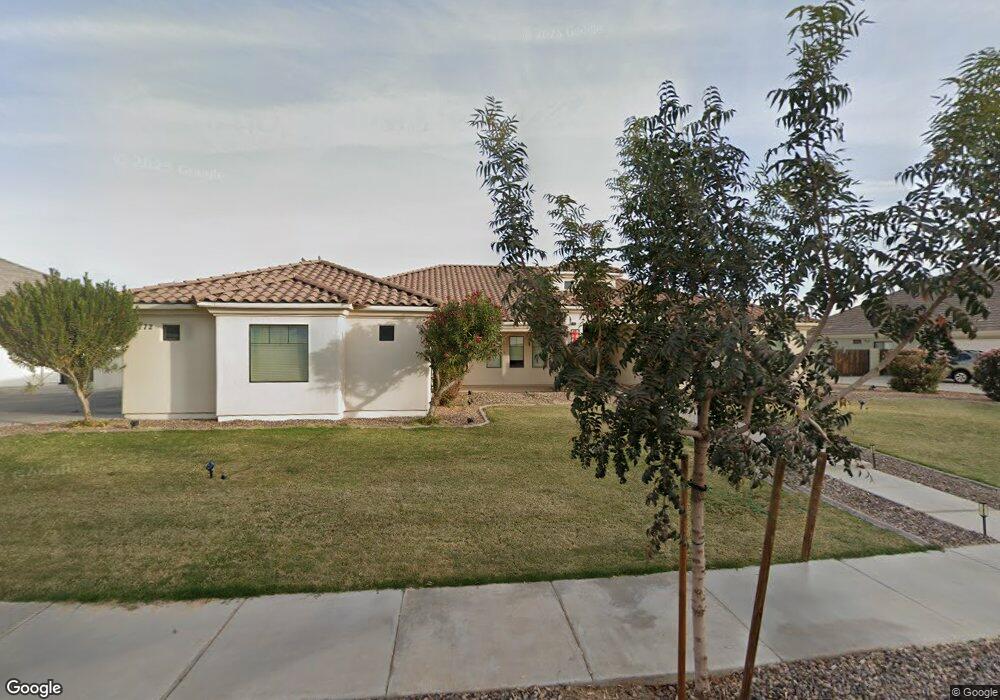
19772 E Julius Rd Queen Creek, AZ 85142
Estimated Value: $788,000 - $925,000
--
Bed
4
Baths
2,963
Sq Ft
$288/Sq Ft
Est. Value
About This Home
This home is located at 19772 E Julius Rd, Queen Creek, AZ 85142 and is currently estimated at $854,282, approximately $288 per square foot. 19772 E Julius Rd is a home located in Maricopa County with nearby schools including Desert Mountain Elementary School, Queen Creek Junior High School, and American Leadership Academy, Queen Creek K-6.
Ownership History
Date
Name
Owned For
Owner Type
Purchase Details
Closed on
Nov 10, 2017
Sold by
Porter Brynn L and Poter Chase G
Bought by
Porter Chase Bryan and Porter Brynn
Current Estimated Value
Home Financials for this Owner
Home Financials are based on the most recent Mortgage that was taken out on this home.
Original Mortgage
$124,000
Outstanding Balance
$68,140
Interest Rate
3.85%
Mortgage Type
New Conventional
Estimated Equity
$786,142
Purchase Details
Closed on
Sep 23, 2015
Sold by
Porter Chase Gibson and Porter Brynn
Bought by
Chase & Brynn Porter Family Trust and Porter Brynn
Purchase Details
Closed on
Feb 8, 2005
Sold by
Tdh Development Llc
Bought by
Porter Chase Gibson and Porter Brynn
Home Financials for this Owner
Home Financials are based on the most recent Mortgage that was taken out on this home.
Original Mortgage
$98,440
Interest Rate
5.81%
Mortgage Type
Purchase Money Mortgage
Create a Home Valuation Report for This Property
The Home Valuation Report is an in-depth analysis detailing your home's value as well as a comparison with similar homes in the area
Home Values in the Area
Average Home Value in this Area
Purchase History
| Date | Buyer | Sale Price | Title Company |
|---|---|---|---|
| Porter Chase Bryan | -- | Security Title Agency Inc | |
| Porter Brynn L | -- | Security Title Agency Inc | |
| Chase & Brynn Porter Family Trust | -- | None Available | |
| Porter Chase Gibson | $123,050 | First American Title Ins Co |
Source: Public Records
Mortgage History
| Date | Status | Borrower | Loan Amount |
|---|---|---|---|
| Open | Porter Brynn L | $124,000 | |
| Closed | Porter Chase Gibson | $98,440 |
Source: Public Records
Tax History Compared to Growth
Tax History
| Year | Tax Paid | Tax Assessment Tax Assessment Total Assessment is a certain percentage of the fair market value that is determined by local assessors to be the total taxable value of land and additions on the property. | Land | Improvement |
|---|---|---|---|---|
| 2025 | $3,233 | $37,364 | -- | -- |
| 2024 | $3,495 | $35,585 | -- | -- |
| 2023 | $3,495 | $69,530 | $13,900 | $55,630 |
| 2022 | $3,393 | $54,050 | $10,810 | $43,240 |
| 2021 | $3,467 | $50,720 | $10,140 | $40,580 |
| 2020 | $3,357 | $43,180 | $8,630 | $34,550 |
| 2019 | $3,304 | $38,860 | $7,770 | $31,090 |
| 2018 | $3,170 | $35,880 | $7,170 | $28,710 |
| 2017 | $3,249 | $35,300 | $7,060 | $28,240 |
| 2016 | $3,348 | $33,760 | $6,750 | $27,010 |
| 2015 | $2,788 | $31,580 | $6,310 | $25,270 |
Source: Public Records
Map
Nearby Homes
- 19943 E Augustus Ave
- 19943 E Strawberry Dr
- 19699 E Apricot Ln
- 19880 E Apricot Ln
- 19837 E Thornton Rd
- 21640 S Hawes Rd
- 21915 S Reina Dr
- 19604 E Thornton Rd
- 19801 E Ocotillo Rd Unit 19
- 19813 E Carriage Way
- 20258 S 196th St
- 19617 E Ocotillo Rd
- 19279 E Peartree Ln
- 20198 E Rosa Rd
- 19655 E Reins Rd
- 20252 E Quintero Rd
- 20149 E Estrella Rd
- 19801 E Ocotillo Lot 2 Rd Unit 19
- 19801 E Ocotillo - Lot 1 Rd Unit 19
- 21975 S 193rd Way
- 19760 E Julius Rd
- 19784 E Julius Rd
- 19765 E Augustus Ave
- 19781 E Augustus Ave
- 19775 E Julius Rd
- 19783 E Julius Rd
- 19748 E Julius Rd
- 19796 E Julius Rd Unit 98
- 19767 E Julius Rd
- 19791 E Julius Rd Unit 76
- 19749 E Augustus Ave
- 19797 E Augustus Ave
- 19759 E Julius Rd
- 19766 E Augustus Ave
- 19719 E Julius Rd Unit 85
- 19799 E Julius Rd
- 19736 E Julius Rd
- 19751 E Julius Rd
- 19764 E Augustus Ave
- 19733 E Augustus Ave