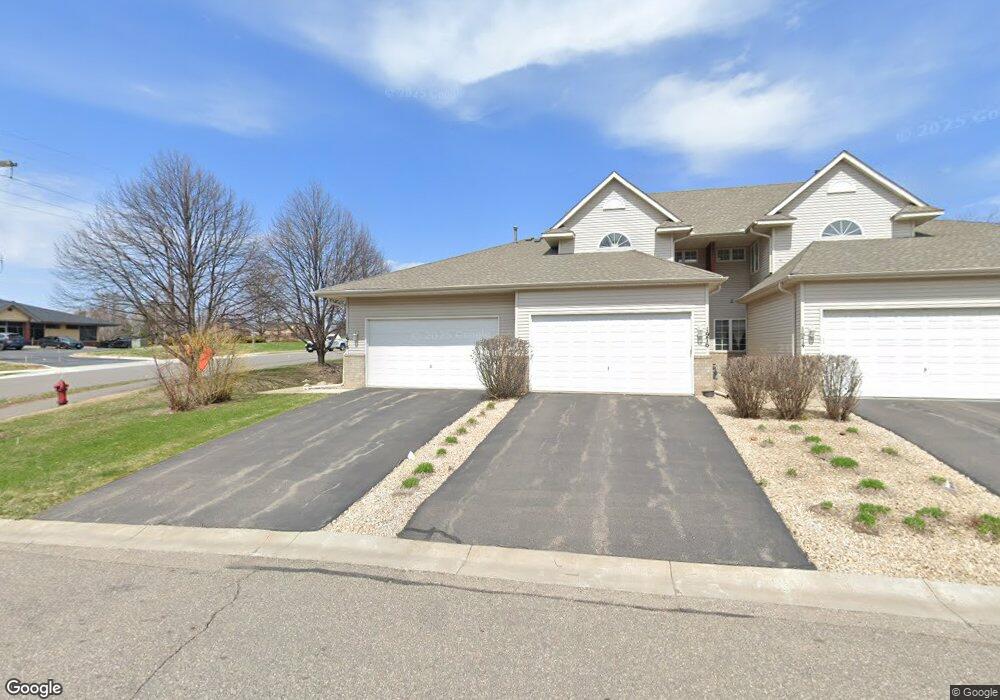
1978 Andrew Ct Chanhassen, MN 55317
Estimated Value: $364,000 - $426,000
3
Beds
3
Baths
1,134
Sq Ft
$346/Sq Ft
Est. Value
About This Home
This home is located at 1978 Andrew Ct, Chanhassen, MN 55317 and is currently estimated at $392,361, approximately $345 per square foot. 1978 Andrew Ct is a home located in Carver County with nearby schools including Bluff Creek Elementary, Chaska Middle School West, and Chanhassen High School.
Ownership History
Date
Name
Owned For
Owner Type
Purchase Details
Closed on
Aug 29, 2018
Sold by
Chang Minchih
Bought by
Chang Min Chih and The Min Chang Living Trust
Current Estimated Value
Purchase Details
Closed on
Aug 22, 2017
Sold by
Benson Janice E
Bought by
Chang Minchih
Purchase Details
Closed on
Jul 27, 2006
Sold by
Robilliard Kathy
Bought by
Benson Janice E
Home Financials for this Owner
Home Financials are based on the most recent Mortgage that was taken out on this home.
Original Mortgage
$120,000
Interest Rate
6.85%
Mortgage Type
New Conventional
Purchase Details
Closed on
Mar 19, 1999
Sold by
Alta Ltd
Bought by
Donovan Kathy J
Purchase Details
Closed on
Jun 13, 1997
Sold by
Heritage Development Of Minnesota Inc
Bought by
Mgm Construction Inc
Create a Home Valuation Report for This Property
The Home Valuation Report is an in-depth analysis detailing your home's value as well as a comparison with similar homes in the area
Home Values in the Area
Average Home Value in this Area
Purchase History
| Date | Buyer | Sale Price | Title Company |
|---|---|---|---|
| Chang Min Chih | -- | None Available | |
| Chang Minchih | $304,000 | Tradition Title Llc | |
| Benson Janice E | $259,900 | -- | |
| Donovan Kathy J | $149,300 | -- | |
| Mgm Construction Inc | $146,000 | -- |
Source: Public Records
Mortgage History
| Date | Status | Borrower | Loan Amount |
|---|---|---|---|
| Previous Owner | Benson Janice E | $120,000 |
Source: Public Records
Tax History Compared to Growth
Tax History
| Year | Tax Paid | Tax Assessment Tax Assessment Total Assessment is a certain percentage of the fair market value that is determined by local assessors to be the total taxable value of land and additions on the property. | Land | Improvement |
|---|---|---|---|---|
| 2025 | $3,250 | $336,500 | $85,000 | $251,500 |
| 2024 | $3,124 | $326,500 | $75,000 | $251,500 |
| 2023 | $3,018 | $310,100 | $75,000 | $235,100 |
| 2022 | $2,946 | $302,700 | $72,600 | $230,100 |
| 2021 | $2,750 | $252,500 | $60,500 | $192,000 |
| 2020 | $2,820 | $252,500 | $60,500 | $192,000 |
| 2019 | $2,810 | $241,600 | $57,600 | $184,000 |
| 2018 | $2,422 | $241,600 | $57,600 | $184,000 |
| 2017 | $2,580 | $206,600 | $52,400 | $154,200 |
| 2016 | $2,338 | $166,400 | $0 | $0 |
| 2015 | $2,764 | $162,100 | $0 | $0 |
| 2014 | $2,764 | $185,000 | $0 | $0 |
Source: Public Records
Map
Nearby Homes
- 8141 Maplewood Terrace
- 2056 Waterleaf Ln W
- 2029 Poppy Dr
- 7846 Autumn Ridge Ave
- 2284 Stone Creek Ln W
- 2263 Stone Creek Ln E
- 2231 Stone Creek Dr
- 7703 Vasserman Place
- 7423 Fawn Hill Rd
- 1321 Lake Dr W Unit 216
- 1250 Lake Susan Hills Dr
- 7266 Fawn Hill Rd
- 2408 Hunter Dr
- 7136 Pearl Dr
- 8410 Burlwood Dr
- 7053 Pearl Dr
- 2794 Century Cir
- 2165 Longacres Dr
- 8800 Sunset Trail
- 7216 Gunflint Trail
- 1976 Andrew Ct
- 1974 Andrew Ct
- 1972 Andrew Ct
- 1956 Andrew Ct
- 1954 Andrew Ct
- 1973 Andrew Ct
- 1950 Andrew Ct
- 1971 Andrew Ct
- 1969 Andrew Ct
- 1967 Andrew Ct
- 1946 Andrew Ct
- 2025 Coulter Blvd
- 1944 Andrew Ct
- 1947 Andrew Ct
- 1938 Andrew Ct
- 1945 Andrew Ct
- 1936 Andrew Ct
- 1934 Andrew Ct
- 1943 Andrew Ct
- 1932 Andrew Ct