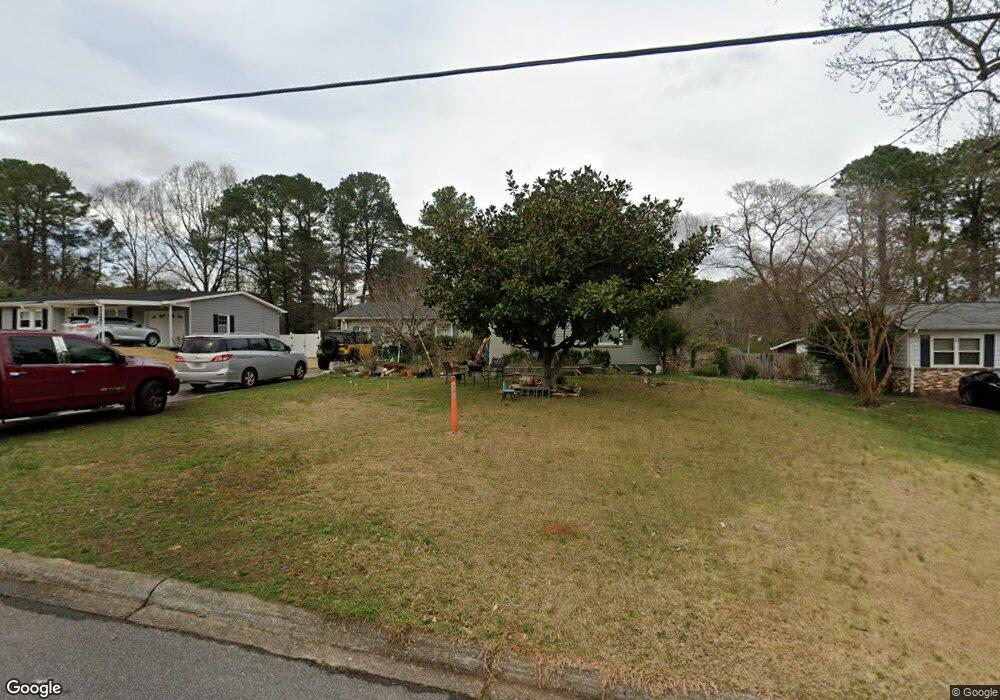
1978 Inverness Rd SE Unit 2 Smyrna, GA 30080
Estimated Value: $389,899 - $423,000
4
Beds
2
Baths
1,355
Sq Ft
$306/Sq Ft
Est. Value
About This Home
This home is located at 1978 Inverness Rd SE Unit 2, Smyrna, GA 30080 and is currently estimated at $413,975, approximately $305 per square foot. 1978 Inverness Rd SE Unit 2 is a home located in Cobb County with nearby schools including Smyrna Elementary School, Campbell Middle School, and Campbell High School.
Ownership History
Date
Name
Owned For
Owner Type
Purchase Details
Closed on
Feb 28, 2005
Sold by
Conley Christopher G
Bought by
Velazquez Luis A
Current Estimated Value
Home Financials for this Owner
Home Financials are based on the most recent Mortgage that was taken out on this home.
Original Mortgage
$131,200
Outstanding Balance
$66,072
Interest Rate
5.61%
Mortgage Type
New Conventional
Estimated Equity
$347,903
Purchase Details
Closed on
May 30, 2001
Sold by
Gramling Kim L and Gramling Daryl W
Bought by
Conley Christopher G
Home Financials for this Owner
Home Financials are based on the most recent Mortgage that was taken out on this home.
Original Mortgage
$118,400
Interest Rate
7.08%
Mortgage Type
New Conventional
Purchase Details
Closed on
Jan 25, 1999
Sold by
Cochran Bobby C and Cochran Mary L
Bought by
Gramling Daryl W and Gramling Kim L
Home Financials for this Owner
Home Financials are based on the most recent Mortgage that was taken out on this home.
Original Mortgage
$113,450
Interest Rate
7.79%
Mortgage Type
New Conventional
Create a Home Valuation Report for This Property
The Home Valuation Report is an in-depth analysis detailing your home's value as well as a comparison with similar homes in the area
Home Values in the Area
Average Home Value in this Area
Purchase History
| Date | Buyer | Sale Price | Title Company |
|---|---|---|---|
| Velazquez Luis A | $164,000 | -- | |
| Conley Christopher G | $148,000 | -- | |
| Gramling Daryl W | $117,000 | -- |
Source: Public Records
Mortgage History
| Date | Status | Borrower | Loan Amount |
|---|---|---|---|
| Open | Velazquez Luis A | $131,200 | |
| Previous Owner | Conley Christopher G | $118,400 | |
| Previous Owner | Gramling Daryl W | $113,450 |
Source: Public Records
Tax History Compared to Growth
Tax History
| Year | Tax Paid | Tax Assessment Tax Assessment Total Assessment is a certain percentage of the fair market value that is determined by local assessors to be the total taxable value of land and additions on the property. | Land | Improvement |
|---|---|---|---|---|
| 2025 | $3,831 | $141,036 | $48,000 | $93,036 |
| 2024 | $4,130 | $152,060 | $40,000 | $112,060 |
| 2023 | $3,456 | $127,264 | $28,000 | $99,264 |
| 2022 | $3,482 | $127,264 | $28,000 | $99,264 |
| 2021 | $3,053 | $111,044 | $28,000 | $83,044 |
| 2020 | $2,274 | $82,728 | $22,000 | $60,728 |
| 2019 | $2,227 | $81,008 | $20,000 | $61,008 |
| 2018 | $2,227 | $81,008 | $20,000 | $61,008 |
| 2017 | $1,632 | $63,264 | $20,000 | $43,264 |
| 2016 | $1,632 | $63,264 | $20,000 | $43,264 |
| 2015 | $1,378 | $52,192 | $20,000 | $32,192 |
| 2014 | $1,391 | $52,192 | $0 | $0 |
Source: Public Records
Map
Nearby Homes
- 1876 Balmoral Rd SE
- 2010 Glenroy Dr SE
- 801 Countryside Place SE
- 1903 Lochlomand Ln SE
- 2376 Oakwood Way SE
- 1601 Countryside Place SE
- 2324 Goodwood Blvd SE
- 1944 Terri Meyer Dr SE
- 1913 Heathridge Ct SE
- 1502 Countryside Place SE
- 2327 Goodwood Blvd SE
- 2051 Dundee Dr SE
- 110 Countryside Place SE
- 108 Countryside Place SE
- 1837 Lochlomand Ln SE
- 1836 Lochlomand Ln SE
- 1108 Country Park Dr SE
- 907 Country Park Dr SE
- 906 Country Park Dr SE
- 1799 Timber Valley Way SE
- 1990 Inverness Rd SE
- 1968 Inverness Rd SE
- 2002 Glenroy Place SE
- 1958 Inverness Rd SE
- 2000 Inverness Rd SE
- 0 Inverness Rd Unit 3149372
- 2016 Glenroy Place SE
- 1998 Glenroy Place SE
- 1985 Inverness Rd SE Unit II
- 2020 Glenroy Place SE
- 1990 Glenroy Place SE
- 1950 Inverness Rd SE
- 1979 Inverness Rd SE
- 2005 Inverness Rd SE
- 1965 Inverness Rd SE Unit 2
- 2018 Inverness Rd SE
- 2930 Highland Dr SE
- 2015 Inverness Rd SE
- 2918 Highland Dr SE Unit 2918
- 2918 Highland Dr SE Unit 1