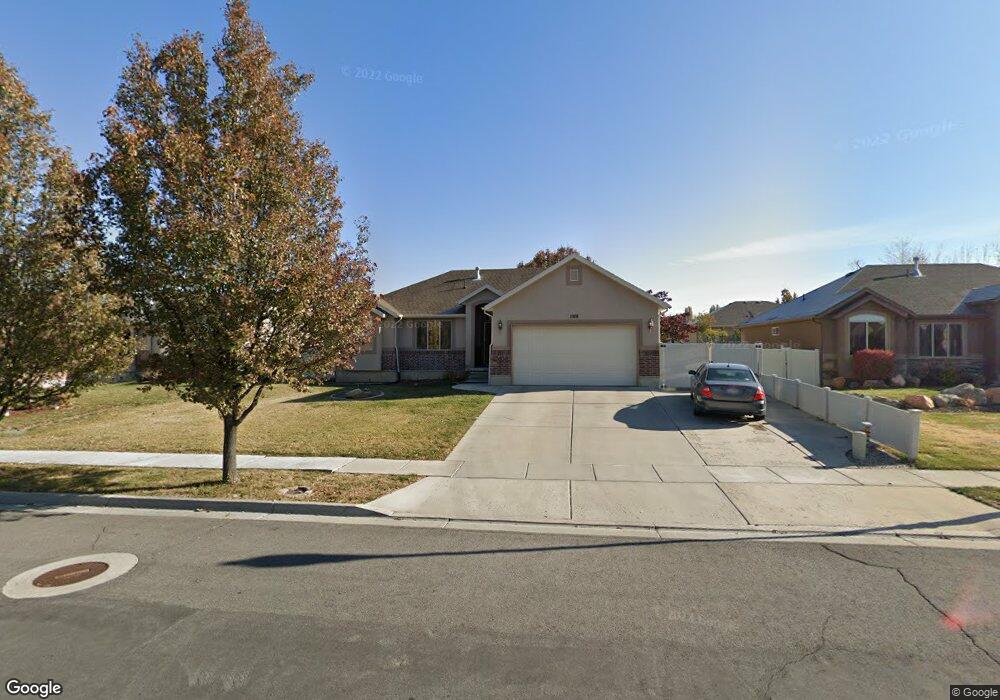
1978 N 2700 W Clearfield, UT 84015
Estimated Value: $475,000 - $568,000
5
Beds
2
Baths
2,909
Sq Ft
$184/Sq Ft
Est. Value
About This Home
This home is located at 1978 N 2700 W, Clearfield, UT 84015 and is currently estimated at $536,143, approximately $184 per square foot. 1978 N 2700 W is a home located in Davis County with nearby schools including West Clinton Elementary School, West Point Junior High School, and Clearfield High School.
Ownership History
Date
Name
Owned For
Owner Type
Purchase Details
Closed on
Oct 28, 2019
Sold by
Rumsey Michael B
Bought by
Rumsey Michael B and Rumsey Jennifer
Current Estimated Value
Home Financials for this Owner
Home Financials are based on the most recent Mortgage that was taken out on this home.
Original Mortgage
$304,061
Outstanding Balance
$266,878
Interest Rate
3.7%
Mortgage Type
New Conventional
Estimated Equity
$269,265
Purchase Details
Closed on
Dec 28, 2016
Sold by
Bennion Brant D and Bennionz Ashley N
Bought by
Rumsey Michael B
Home Financials for this Owner
Home Financials are based on the most recent Mortgage that was taken out on this home.
Original Mortgage
$284,747
Interest Rate
4.12%
Mortgage Type
FHA
Purchase Details
Closed on
Dec 25, 2016
Sold by
Rumsey Michael B
Bought by
Rumsey Michael B and Rumsey Jennifer
Home Financials for this Owner
Home Financials are based on the most recent Mortgage that was taken out on this home.
Original Mortgage
$284,747
Interest Rate
4.12%
Mortgage Type
FHA
Purchase Details
Closed on
Jun 20, 2013
Sold by
Bennion Brant D
Bought by
Bennion Brant D and Bennion Ashley N
Home Financials for this Owner
Home Financials are based on the most recent Mortgage that was taken out on this home.
Original Mortgage
$11,032
Interest Rate
3.38%
Mortgage Type
Stand Alone Second
Purchase Details
Closed on
Jun 19, 2013
Sold by
Metcalf Jason L and Metcalf Katie G
Bought by
Bennion Brant D
Home Financials for this Owner
Home Financials are based on the most recent Mortgage that was taken out on this home.
Original Mortgage
$11,032
Interest Rate
3.38%
Mortgage Type
Stand Alone Second
Purchase Details
Closed on
Aug 31, 2006
Sold by
Destination Homes Inc
Bought by
Metcalf Jason L and Metcalf Katie G
Home Financials for this Owner
Home Financials are based on the most recent Mortgage that was taken out on this home.
Original Mortgage
$205,469
Interest Rate
6.76%
Mortgage Type
VA
Purchase Details
Closed on
May 5, 2005
Sold by
Hamblin Investments Inc
Bought by
M & D Developers Llc
Home Financials for this Owner
Home Financials are based on the most recent Mortgage that was taken out on this home.
Original Mortgage
$230,737
Interest Rate
5.77%
Mortgage Type
Purchase Money Mortgage
Purchase Details
Closed on
Apr 12, 2005
Sold by
M & D Developers Llc
Bought by
Destinnation Homes Inc
Home Financials for this Owner
Home Financials are based on the most recent Mortgage that was taken out on this home.
Original Mortgage
$230,737
Interest Rate
5.77%
Mortgage Type
Purchase Money Mortgage
Create a Home Valuation Report for This Property
The Home Valuation Report is an in-depth analysis detailing your home's value as well as a comparison with similar homes in the area
Home Values in the Area
Average Home Value in this Area
Purchase History
| Date | Buyer | Sale Price | Title Company |
|---|---|---|---|
| Rumsey Michael B | -- | Accommodation | |
| Rumsey Michael B | -- | Backman Title Ser | |
| Rumsey Michael B | -- | Security Title | |
| Rumsey Michael B | -- | Security Title | |
| Bennion Brant D | -- | Security Title Of Davis Coun | |
| Bennion Brant D | -- | Cornerstone Title In | |
| Metcalf Jason L | -- | Bonneville Superior Title Co | |
| M & D Developers Llc | -- | None Available | |
| Destinnation Homes Inc | -- | Heritage West Title Ins Agen |
Source: Public Records
Mortgage History
| Date | Status | Borrower | Loan Amount |
|---|---|---|---|
| Open | Rumsey Michael B | $304,061 | |
| Closed | Rumsey Michael B | $284,747 | |
| Previous Owner | Bennion Brant D | $11,032 | |
| Previous Owner | Bennion Brant D | $224,360 | |
| Previous Owner | Metcalf Jason L | $205,469 | |
| Previous Owner | Destinnation Homes Inc | $230,737 |
Source: Public Records
Tax History Compared to Growth
Tax History
| Year | Tax Paid | Tax Assessment Tax Assessment Total Assessment is a certain percentage of the fair market value that is determined by local assessors to be the total taxable value of land and additions on the property. | Land | Improvement |
|---|---|---|---|---|
| 2025 | $2,900 | $278,850 | $85,155 | $193,695 |
| 2024 | $2,783 | $268,950 | $94,124 | $174,826 |
| 2023 | $2,516 | $450,000 | $106,177 | $343,823 |
| 2022 | $2,680 | $265,101 | $66,072 | $199,029 |
| 2021 | $2,439 | $358,000 | $80,820 | $277,180 |
| 2020 | $2,121 | $308,000 | $67,689 | $240,311 |
| 2019 | $2,093 | $297,000 | $80,934 | $216,066 |
| 2018 | $1,958 | $273,000 | $68,602 | $204,398 |
| 2016 | $1,710 | $123,090 | $25,587 | $97,503 |
| 2015 | $1,788 | $122,375 | $25,587 | $96,788 |
| 2014 | $1,749 | $121,583 | $25,587 | $95,996 |
| 2013 | -- | $113,665 | $24,320 | $89,345 |
Source: Public Records
Map
Nearby Homes
- 1958 N 2750 W
- 2617 N 2080 W Unit 176
- Harvard Plan at Summerfield - Enclave
- 2208 W 2615 N
- Linden Plan at Summerfield - Vista
- Yale Plan at Summerfield - Enclave
- Gambel Oak Plan at Summerfield - Vista
- Cedar Plan at Summerfield - Vista
- Elm Plan at Summerfield - Vista
- Princeton Plan at Summerfield - Enclave
- Cambridge Plan at Summerfield - Enclave
- Cornell Plan at Summerfield - Enclave
- Sycamore Plan at Summerfield - Vista
- Berkeley Plan at Summerfield - Enclave
- Birch Plan at Summerfield - Vista
- Stanford Plan at Summerfield - Enclave
- 1648 N 2615 W
- 3941 W 1800 N
- 2434 W 2250 N
- 2322 N 2500 W