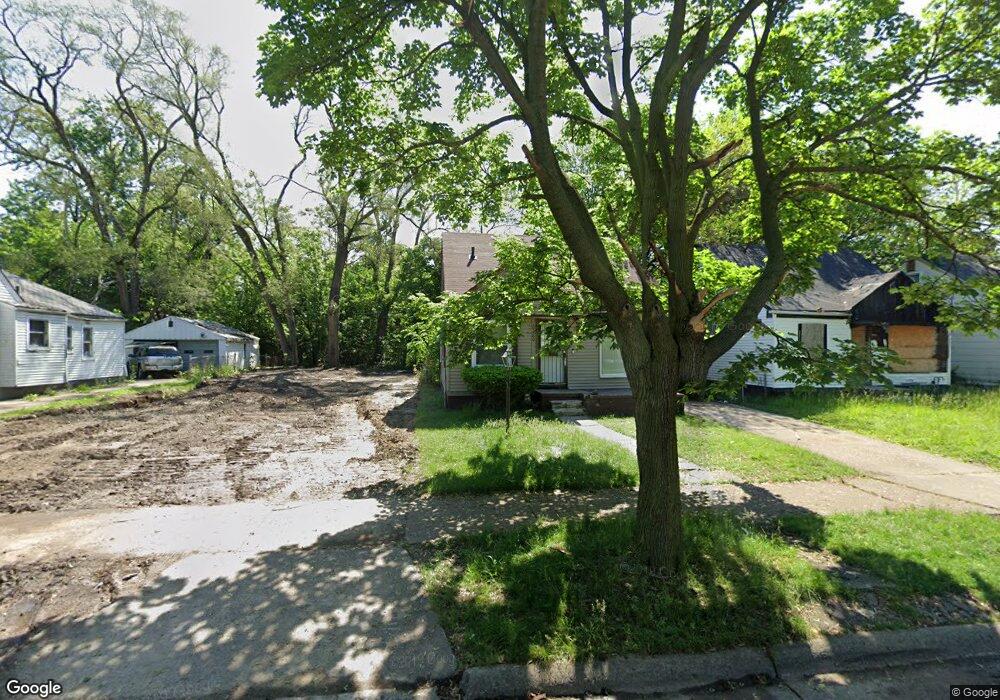
19780 Fenmore St Detroit, MI 48235
Greenfield NeighborhoodEstimated Value: $66,000 - $81,000
--
Bed
1
Bath
912
Sq Ft
$80/Sq Ft
Est. Value
About This Home
This home is located at 19780 Fenmore St, Detroit, MI 48235 and is currently estimated at $73,045, approximately $80 per square foot. 19780 Fenmore St is a home located in Wayne County with nearby schools including Bow Elementary-Middle School, Charles L. Spain Elementary-Middle School, and Edward 'Duke' Ellington Conservatory of Music and Art.
Ownership History
Date
Name
Owned For
Owner Type
Purchase Details
Closed on
Jul 1, 2009
Sold by
Bruner Nicholas and Bruner Sheshona D
Bought by
Tri Star Investments
Current Estimated Value
Purchase Details
Closed on
Jul 21, 2006
Sold by
Bruner Leatha Ann and Coleman Leatha
Bought by
Bruner Nicholas
Home Financials for this Owner
Home Financials are based on the most recent Mortgage that was taken out on this home.
Original Mortgage
$67,200
Interest Rate
10.47%
Mortgage Type
Purchase Money Mortgage
Create a Home Valuation Report for This Property
The Home Valuation Report is an in-depth analysis detailing your home's value as well as a comparison with similar homes in the area
Home Values in the Area
Average Home Value in this Area
Purchase History
| Date | Buyer | Sale Price | Title Company |
|---|---|---|---|
| Tri Star Investments | $1,701 | None Available | |
| Bruner Nicholas | $84,000 | Abstract Title Agency |
Source: Public Records
Mortgage History
| Date | Status | Borrower | Loan Amount |
|---|---|---|---|
| Previous Owner | Bruner Nicholas | $67,200 |
Source: Public Records
Tax History Compared to Growth
Tax History
| Year | Tax Paid | Tax Assessment Tax Assessment Total Assessment is a certain percentage of the fair market value that is determined by local assessors to be the total taxable value of land and additions on the property. | Land | Improvement |
|---|---|---|---|---|
| 2025 | $841 | $31,200 | $0 | $0 |
| 2024 | $841 | $28,000 | $0 | $0 |
| 2023 | $814 | $22,200 | $0 | $0 |
| 2022 | $762 | $17,900 | $0 | $0 |
| 2021 | $862 | $14,200 | $0 | $0 |
| 2020 | $854 | $13,000 | $0 | $0 |
| 2019 | $843 | $10,600 | $0 | $0 |
| 2018 | $732 | $8,800 | $0 | $0 |
| 2017 | $156 | $8,200 | $0 | $0 |
| 2016 | $1,005 | $12,700 | $0 | $0 |
| 2015 | $1,270 | $12,700 | $0 | $0 |
| 2013 | $1,781 | $17,812 | $0 | $0 |
| 2010 | -- | $25,520 | $689 | $24,831 |
Source: Public Records
Map
Nearby Homes
- 19765 Archdale St
- 19731 Harlow St
- 19925 Archdale St
- 19781 Oakfield St
- 19751 Oakfield St
- 19780 Oakfield St
- 19786 Oakfield St
- 19433 Fenmore St
- 18231 Pembroke Ave
- 19425 Fenmore St
- 20004 Southfield Fwy
- 19950 Oakfield St
- 20014 Southfield Rd
- 19377 Fenmore St
- 19400 Harlow St
- 20052 Archdale St
- 19365 Fenmore St
- 20051 Oakfield St
- 19345 Fenmore St
- 19379 Ashton Ave
- 19788 Fenmore St
- 19772 Fenmore St
- 19766 Fenmore St
- 19794 Fenmore St
- 19758 Fenmore St
- 19800 Fenmore St
- 19795 Archdale St
- 19810 Fenmore St
- 19750 Fenmore St
- 19757 Archdale St
- 19901 Archdale St
- 19801 Archdale St Unit Bldg-Unit
- 19801 Archdale St
- 19787 Fenmore St
- 19771 Fenmore St
- 19746 Fenmore St
- 19793 Fenmore St
- 19751 Archdale St
- 19781 Fenmore St
- 19759 Fenmore St