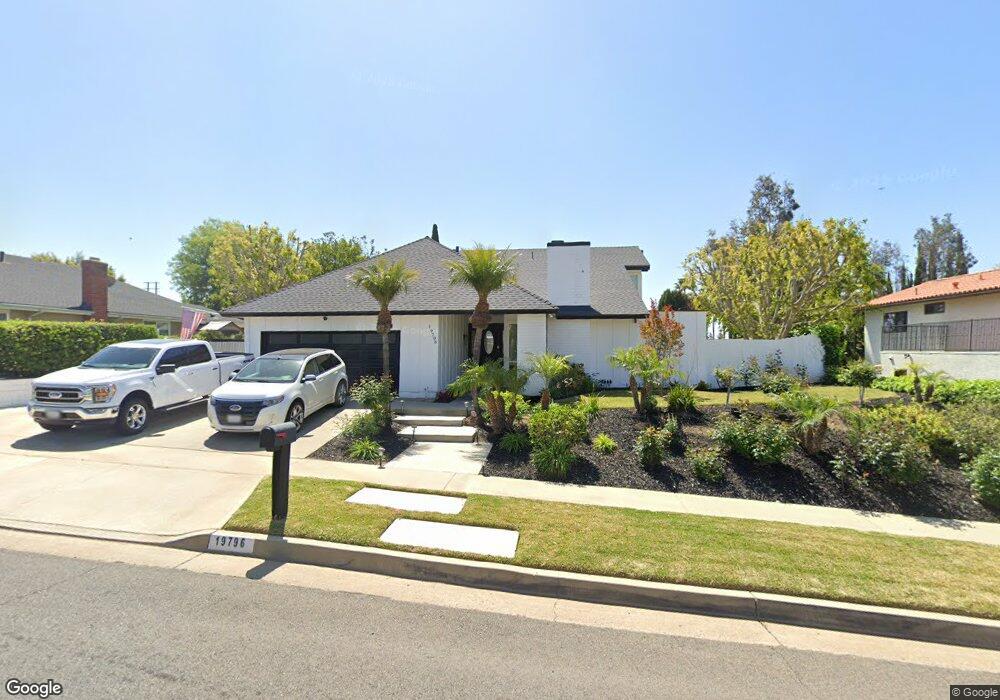
19796 Burleigh Dr Yorba Linda, CA 92886
Estimated Value: $1,490,000 - $1,666,000
5
Beds
3
Baths
2,749
Sq Ft
$574/Sq Ft
Est. Value
About This Home
This home is located at 19796 Burleigh Dr, Yorba Linda, CA 92886 and is currently estimated at $1,578,205, approximately $574 per square foot. 19796 Burleigh Dr is a home located in Orange County with nearby schools including Fairmont Elementary, Bernardo Yorba Middle School, and Ivycrest Montessori Private School - Yorba Linda.
Ownership History
Date
Name
Owned For
Owner Type
Purchase Details
Closed on
Sep 18, 2012
Sold by
Gates Veda G
Bought by
Gates Veda G and Veda G Gates Separate Property Trust
Current Estimated Value
Purchase Details
Closed on
Oct 3, 2003
Sold by
Gates Veda G
Bought by
Gates Timothy A and Gates Veda G
Purchase Details
Closed on
Nov 21, 2002
Sold by
Gates Tim A and Gates Veda G
Bought by
Gates Veda G
Home Financials for this Owner
Home Financials are based on the most recent Mortgage that was taken out on this home.
Original Mortgage
$384,000
Outstanding Balance
$162,023
Interest Rate
6.12%
Estimated Equity
$1,416,182
Purchase Details
Closed on
Mar 2, 2000
Sold by
Allen Thomas O and Thomas Robert Thomas
Bought by
Gates Tim A and Gates Veda G
Home Financials for this Owner
Home Financials are based on the most recent Mortgage that was taken out on this home.
Original Mortgage
$292,000
Interest Rate
8.26%
Create a Home Valuation Report for This Property
The Home Valuation Report is an in-depth analysis detailing your home's value as well as a comparison with similar homes in the area
Home Values in the Area
Average Home Value in this Area
Purchase History
| Date | Buyer | Sale Price | Title Company |
|---|---|---|---|
| Gates Veda G | -- | None Available | |
| Gates Timothy A | -- | -- | |
| Gates Veda G | -- | First American Title Ins Co | |
| Gates Tim A | $365,000 | First Southwestern Title Co |
Source: Public Records
Mortgage History
| Date | Status | Borrower | Loan Amount |
|---|---|---|---|
| Open | Gates Veda G | $384,000 | |
| Closed | Gates Tim A | $292,000 |
Source: Public Records
Tax History Compared to Growth
Tax History
| Year | Tax Paid | Tax Assessment Tax Assessment Total Assessment is a certain percentage of the fair market value that is determined by local assessors to be the total taxable value of land and additions on the property. | Land | Improvement |
|---|---|---|---|---|
| 2025 | $6,407 | $560,988 | $378,026 | $182,962 |
| 2024 | $6,407 | $549,989 | $370,614 | $179,375 |
| 2023 | $6,279 | $539,205 | $363,347 | $175,858 |
| 2022 | $6,190 | $528,633 | $356,223 | $172,410 |
| 2021 | $6,091 | $518,268 | $349,238 | $169,030 |
| 2020 | $6,088 | $512,954 | $345,657 | $167,297 |
| 2019 | $5,878 | $502,897 | $338,880 | $164,017 |
| 2018 | $5,797 | $493,037 | $332,236 | $160,801 |
| 2017 | $5,696 | $483,370 | $325,721 | $157,649 |
| 2016 | $5,577 | $473,893 | $319,335 | $154,558 |
| 2015 | $5,499 | $466,775 | $314,538 | $152,237 |
| 2014 | $5,338 | $457,632 | $308,377 | $149,255 |
Source: Public Records
Map
Nearby Homes
- 19862 Le Mans Cir
- 19831 Caprice Dr
- 19762 Ridgewood Place
- 19841 Lombardy Ln
- 4774 Serrente Plaza
- 5312 Kentwater Place
- 91 VAC/COR E Avenue L
- 20361 Via Juana
- 4741 Cardena Plaza
- 5540 Via Sara
- 19701 Parkview Terrace
- 5031 Fairway View Dr
- 4545 Avenida Rio Del Oro
- 4446 Avenida de Las Flores
- 5245 Grandview Ave
- 20455 Via Cadiz
- 5371 Grandview Ave
- 18931 Gordon Ln
- 6025 Kingsbriar Dr
- 19072 Lamplight Ln
- 19812 Burleigh Dr
- 19782 Burleigh Dr
- 19795 Le Mans Cir
- 19811 Le Mans Cir
- 19781 Le Mans Cir
- 19826 Burleigh Dr
- 19762 Burleigh Dr
- 19795 Burleigh Dr
- 19825 Le Mans Cir
- 19781 Burleigh Dr
- 19761 Le Mans Cir
- 19846 Burleigh Dr
- 19825 Burleigh Dr
- 19841 Le Mans Cir
- 19845 Burleigh Dr
- 19796 Le Mans Cir
- 19796 Villager Cir
- 19812 Le Mans Cir
- 19782 Le Mans Cir
- 19816 Villager Cir