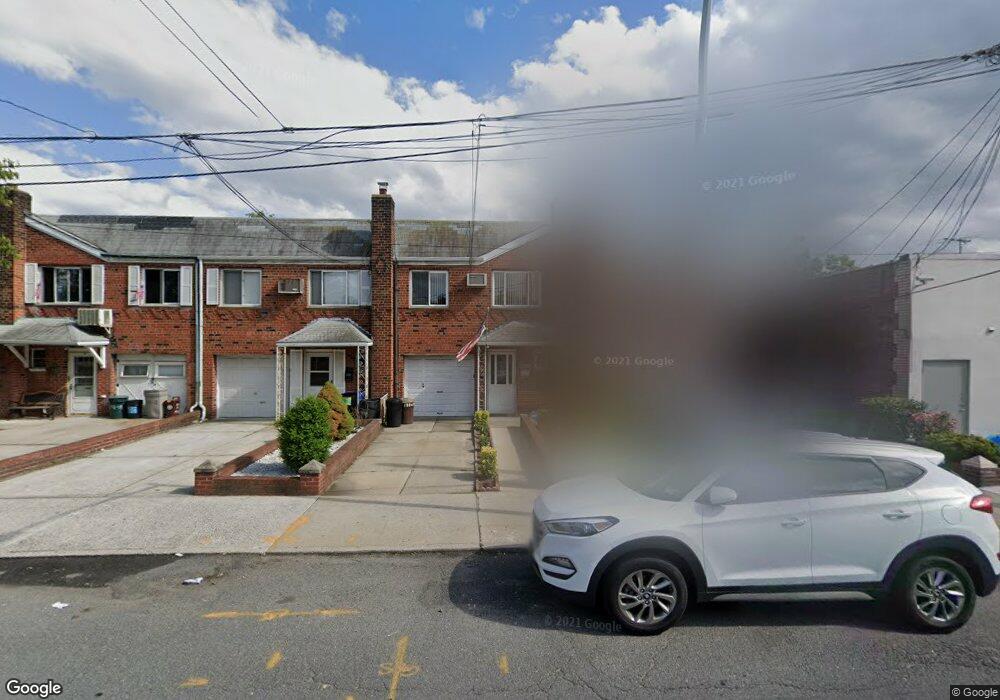
198-14 32nd Ave Unit 2 Flushing, NY 11358
Auburndale NeighborhoodEstimated Value: $1,028,005 - $1,210,000
2
Beds
1
Bath
960
Sq Ft
$1,201/Sq Ft
Est. Value
About This Home
This home is located at 198-14 32nd Ave Unit 2, Flushing, NY 11358 and is currently estimated at $1,152,501, approximately $1,200 per square foot. 198-14 32nd Ave Unit 2 is a home located in Queens County with nearby schools including P.S. 159 Queens, I.S. 25 Adrien Block, and Bayside High School.
Ownership History
Date
Name
Owned For
Owner Type
Purchase Details
Closed on
Jun 27, 2022
Sold by
Hogan Trustee Patricia Ann and Joseph Lauri Irrevocable Living Trust
Bought by
Zheng Sean Xiang
Current Estimated Value
Home Financials for this Owner
Home Financials are based on the most recent Mortgage that was taken out on this home.
Original Mortgage
$499,900
Outstanding Balance
$477,067
Interest Rate
5.78%
Mortgage Type
Purchase Money Mortgage
Estimated Equity
$675,434
Purchase Details
Closed on
Feb 12, 2010
Sold by
Lauri Joseph
Bought by
Hogan As Trustee Patricia A and Joseph Lauri Irrevocable Living Trust
Purchase Details
Closed on
Mar 29, 2000
Sold by
Lauri Joseph and Syper Debra
Bought by
Lauri Joseph
Create a Home Valuation Report for This Property
The Home Valuation Report is an in-depth analysis detailing your home's value as well as a comparison with similar homes in the area
Home Values in the Area
Average Home Value in this Area
Purchase History
| Date | Buyer | Sale Price | Title Company |
|---|---|---|---|
| Zheng Sean Xiang | $1,145,000 | -- | |
| Zheng Sean Xiang | $1,145,000 | -- | |
| Zheng Sean Xiang | $1,145,000 | -- | |
| Hogan As Trustee Patricia A | -- | -- | |
| Hogan As Trustee Patricia A | -- | -- | |
| Lauri Joseph | -- | Fidelity National Title Ins | |
| Lauri Joseph | -- | Fidelity National Title Ins |
Source: Public Records
Mortgage History
| Date | Status | Borrower | Loan Amount |
|---|---|---|---|
| Open | Zheng Sean Xiang | $499,900 | |
| Closed | Zheng Sean Xiang | $499,900 |
Source: Public Records
Tax History Compared to Growth
Tax History
| Year | Tax Paid | Tax Assessment Tax Assessment Total Assessment is a certain percentage of the fair market value that is determined by local assessors to be the total taxable value of land and additions on the property. | Land | Improvement |
|---|---|---|---|---|
| 2025 | $9,105 | $47,774 | $8,663 | $39,111 |
| 2024 | $9,105 | $45,334 | $8,519 | $36,815 |
| 2023 | $8,590 | $42,768 | $8,028 | $34,740 |
| 2022 | $5,757 | $52,440 | $10,260 | $42,180 |
| 2021 | $7,979 | $49,020 | $10,260 | $38,760 |
| 2020 | $7,521 | $53,880 | $10,260 | $43,620 |
| 2019 | $6,976 | $54,420 | $10,260 | $44,160 |
| 2018 | $6,380 | $35,640 | $7,145 | $28,495 |
| 2017 | $6,613 | $35,640 | $7,977 | $27,663 |
| 2016 | $6,370 | $35,640 | $7,977 | $27,663 |
| 2015 | $3,518 | $33,177 | $8,841 | $24,336 |
| 2014 | $3,518 | $31,482 | $10,070 | $21,412 |
Source: Public Records
Map
Nearby Homes
- 20015 33rd Ave
- 28-07 172nd St
- 190-16 33rd Ave
- 32-28 202nd St
- 29-31 170th St
- 3321 201st St
- 201-05 28th Ave
- 201-20 28th Ave
- 20206 33rd Ave
- 19934 34th Ave
- 26-23 Utopia Pkwy
- 200-14 34th Ave
- 3211 204th St
- 29-37 168th St
- 3314 204th St
- 199-27 26th Ave
- 19929 26th Ave
- 2931 167th St
- 34-41 201st St
- 3335 204th St
- 198-14 32nd Ave
- 19814 32nd Ave
- 19816 32nd Ave
- 19812 32nd Ave
- 19818 32nd Ave
- 19820 32nd Ave
- 198-24 32nd Ave Unit 1
- 3211 Francis Lewis Blvd
- 19824 32nd Ave
- 19813 32nd Rd
- 19826 32nd Ave
- 198-16 32nd Ave Unit 1
- 19815 32nd Rd
- 19817 32nd Rd
- 19828 32nd Ave
- 19828 32nd Ave
- 19828 32nd Ave Unit 2Floor
- 19811 32nd Rd
- 19819 32nd Rd
- 198-19 32nd Rd Unit 1st+bm