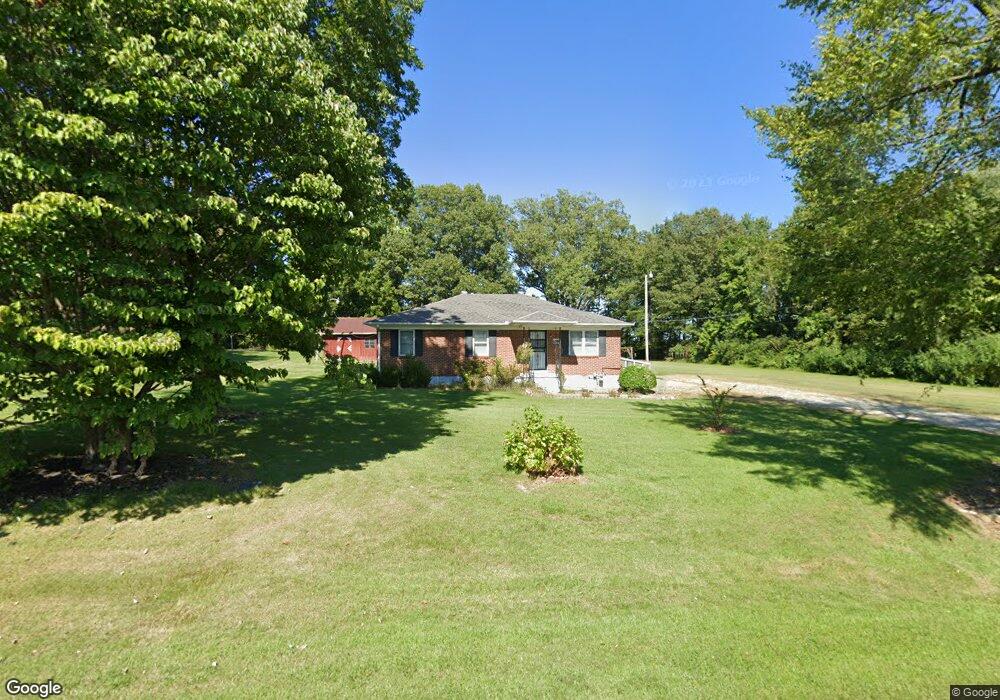
198 Cedar Grove Rd Ripley, TN 38063
Estimated Value: $111,000 - $148,096
--
Bed
1
Bath
1,148
Sq Ft
$113/Sq Ft
Est. Value
About This Home
This home is located at 198 Cedar Grove Rd, Ripley, TN 38063 and is currently estimated at $129,524, approximately $112 per square foot. 198 Cedar Grove Rd is a home located in Lauderdale County with nearby schools including Ripley Primary School, Ripley Elementary School, and Ripley Middle School.
Ownership History
Date
Name
Owned For
Owner Type
Purchase Details
Closed on
May 16, 2024
Sold by
Mailhos Era Marie Newman and Reich Shirley Sue
Bought by
Haynie Cody W
Current Estimated Value
Purchase Details
Closed on
Jan 25, 1996
Sold by
Newman Elbert & Era
Bought by
Lynn Newman Wm
Purchase Details
Closed on
Mar 16, 1963
Bought by
Newman Elbert & Era
Create a Home Valuation Report for This Property
The Home Valuation Report is an in-depth analysis detailing your home's value as well as a comparison with similar homes in the area
Home Values in the Area
Average Home Value in this Area
Purchase History
| Date | Buyer | Sale Price | Title Company |
|---|---|---|---|
| Haynie Cody W | $126,000 | None Listed On Document | |
| Lynn Newman Wm | -- | -- | |
| Newman Elbert & Era | -- | -- |
Source: Public Records
Tax History Compared to Growth
Tax History
| Year | Tax Paid | Tax Assessment Tax Assessment Total Assessment is a certain percentage of the fair market value that is determined by local assessors to be the total taxable value of land and additions on the property. | Land | Improvement |
|---|---|---|---|---|
| 2025 | $411 | $16,375 | $0 | $0 |
| 2024 | $411 | $16,200 | $2,400 | $13,800 |
| 2023 | $411 | $16,200 | $2,400 | $13,800 |
| 2022 | $411 | $16,200 | $2,400 | $13,800 |
| 2021 | $411 | $16,200 | $2,400 | $13,800 |
| 2020 | $343 | $16,200 | $2,400 | $13,800 |
| 2019 | $343 | $11,625 | $2,200 | $9,425 |
| 2018 | $343 | $11,625 | $2,200 | $9,425 |
| 2017 | $346 | $11,625 | $2,200 | $9,425 |
| 2016 | $346 | $11,625 | $2,200 | $9,425 |
| 2015 | $376 | $11,625 | $2,200 | $9,425 |
| 2014 | $376 | $12,950 | $2,350 | $10,600 |
Source: Public Records
Map
Nearby Homes
- 2631 Highway 51 N
- 176 Roy Crain Rd
- 1216 Cedar Grove Ext Rd
- 738 American Way
- 158 Barry White Ln
- 45 Village Ave
- 0 Naber St
- 187 Collins St
- 0 Collins St
- 319 Jordan St
- 5720 Conner Whitefield Rd
- 2440 Edith Nankipoo Rd
- 000 Bluebird Hill Rd
- 622 Bluebird Hill Rd
- 35 Ellis Loop
- 102 Stone Brook Cove
- 107 Stone Brook Cove
- 103 Stone Brook Cove
- 108 Walnut Ridge
- 109 Walnut Ridge
- 248 Cedar Grove Rd
- 126 Cedar Grove Rd
- 292 Cedar Grove Rd
- 351 Cedar Grove Rd
- 412 Cedar Grove Rd
- 1216 Chipman Rd
- 3019 Highway 209 N
- 2727 Highway 209 N
- 460 Cedar Grove Rd
- 3105 Highway 209 N
- 2766 Highway 209 N
- 2736 Highway 209 N
- 2706 Highway 209 N
- 3165 Highway 209 N
- 0 Hunters Trace Dr
- 2641 Highway 209 N
- 82 Hunters Trace Dr
- 2925 Highway 51 N
- 2621 Highway 51 N
- 589 Cedar Grove Rd