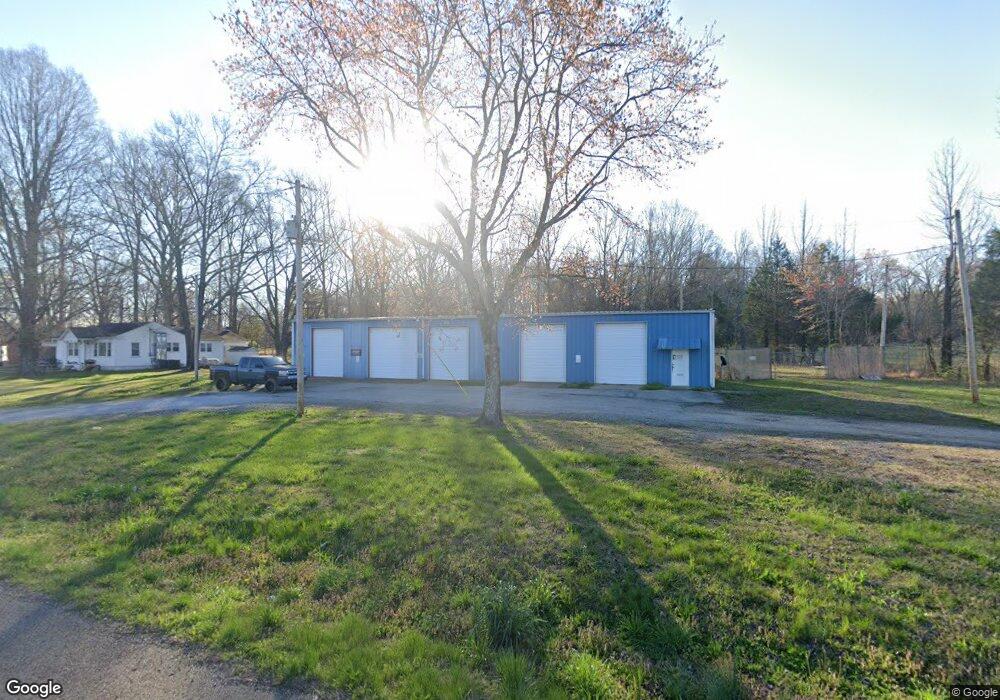
198 Highway 70 E Jackson, TN 38305
Estimated Value: $138,206
Studio
1
Bath
1
Sq Ft
$138,206/Sq Ft
Est. Value
About This Home
This home is located at 198 Highway 70 E, Jackson, TN 38305 and is currently priced at $138,206, approximately $138,206 per square foot. 198 Highway 70 E is a home located in Carroll County with nearby schools including West Carroll Primary School, West Carroll Elementary School, and West Carroll Junior/Senior High School.
Ownership History
Date
Name
Owned For
Owner Type
Purchase Details
Closed on
Aug 15, 2025
Sold by
Johnson Charles Lee
Bought by
Armstrong Joseph T
Current Estimated Value
Home Financials for this Owner
Home Financials are based on the most recent Mortgage that was taken out on this home.
Original Mortgage
$53,700
Interest Rate
6.67%
Mortgage Type
Seller Take Back
Purchase Details
Closed on
Dec 15, 2021
Sold by
Jewell Glenda Cleo
Bought by
Johnson Charles Lee
Purchase Details
Closed on
Jul 1, 2019
Sold by
Ramsey Edward Andrew
Bought by
Johnson Charles Lee
Purchase Details
Closed on
Dec 12, 2013
Sold by
Upstate Properties
Bought by
Ramsey Edward Andrew and Ramsey Phyllis A
Purchase Details
Closed on
Jan 28, 2010
Sold by
Doyle Timothy A
Bought by
Upstate Properties
Purchase Details
Closed on
Jul 11, 2002
Sold by
Mendenhall Sandra P
Bought by
Doyle Timothy A
Purchase Details
Closed on
Oct 31, 1991
Bought by
Pickard Sandra
Purchase Details
Closed on
Oct 4, 1986
Bought by
Pickard Donald W and Pickard Sandra
Create a Home Valuation Report for This Property
The Home Valuation Report is an in-depth analysis detailing your home's value as well as a comparison with similar homes in the area
Purchase History
| Date | Buyer | Sale Price | Title Company |
|---|---|---|---|
| Armstrong Joseph T | $358,000 | None Listed On Document | |
| Johnson Charles Lee | -- | None Listed On Document | |
| Johnson Charles Lee | $77,000 | -- | |
| Ramsey Edward Andrew | -- | -- | |
| Upstate Properties | $80,000 | -- | |
| Doyle Timothy A | -- | -- | |
| Pickard Sandra | -- | -- | |
| Pickard Donald W | $27,000 | -- |
Source: Public Records
Mortgage History
| Date | Status | Borrower | Loan Amount |
|---|---|---|---|
| Closed | Armstrong Joseph T | $53,700 | |
| Open | Armstrong Joseph T | $304,300 |
Source: Public Records
Tax History
| Year | Tax Paid | Tax Assessment Tax Assessment Total Assessment is a certain percentage of the fair market value that is determined by local assessors to be the total taxable value of land and additions on the property. | Land | Improvement |
|---|---|---|---|---|
| 2025 | $451 | $27,520 | $4,000 | $23,520 |
| 2024 | $818 | $31,040 | $3,000 | $28,040 |
| 2023 | $818 | $31,040 | $3,000 | $28,040 |
| 2022 | $818 | $31,040 | $3,000 | $28,040 |
| 2021 | $439 | $31,040 | $3,000 | $28,040 |
| 2020 | $818 | $31,040 | $3,000 | $28,040 |
| 2019 | $286 | $9,840 | $3,000 | $6,840 |
| 2018 | $286 | $9,840 | $3,000 | $6,840 |
| 2017 | $286 | $9,840 | $3,000 | $6,840 |
| 2016 | $419 | $9,840 | $3,000 | $6,840 |
| 2015 | $295 | $9,840 | $3,000 | $6,840 |
| 2014 | $307 | $9,840 | $3,000 | $6,840 |
| 2013 | $307 | $9,937 | $0 | $0 |
Source: Public Records
Map
Nearby Homes
- 0 Hwy 70 Ave Unit 2506026
- 0 Hwy 70 Ave Unit RTC2802275
- 00 Frye Rd
- 223 Spring Creek Law Rd
- 973 Old Lavinia Rd
- 31 Spring Creek Law Rd
- 00 Spring Creek Law Rd
- 945 Old Lavinia Rd
- 0 Lavinia Rd
- 780 Hickory Flat Rd
- 4489 Spring Creek Rd
- 290 Leeford Ln
- 220 Lakewood Dr E
- 23 Springview Dr
- 00 Stan Ln
- Lot 30 Stan Ln
- 30 Stan Ln
- 212 Springview Dr
- 163 Jason Hollow Rd
- 213 Jason Hollow Rd
- 198 & 250 Hwy 70 E
- 250 Highway 70 E
- 23 Deere Ln
- 344 Highway 70 E
- 121 Highway 70 E
- 237 Daniel Rd
- 79 Highway 70 E
- 4110 Highway 70 E
- 176 Deere Ln
- 400 Highway 70 E
- 00 Deere Ln
- 205 Daniel Rd
- 131 Deere Ln
- 165 Deere Ln
- 399 Highway 70 E
- 4104 Highway 70 E
- 200 Daniel Rd
- 4109 Highway 70 E
- 180 Daniel Rd
- 570 Highway 70 E
Your Personal Tour Guide
Ask me questions while you tour the home.