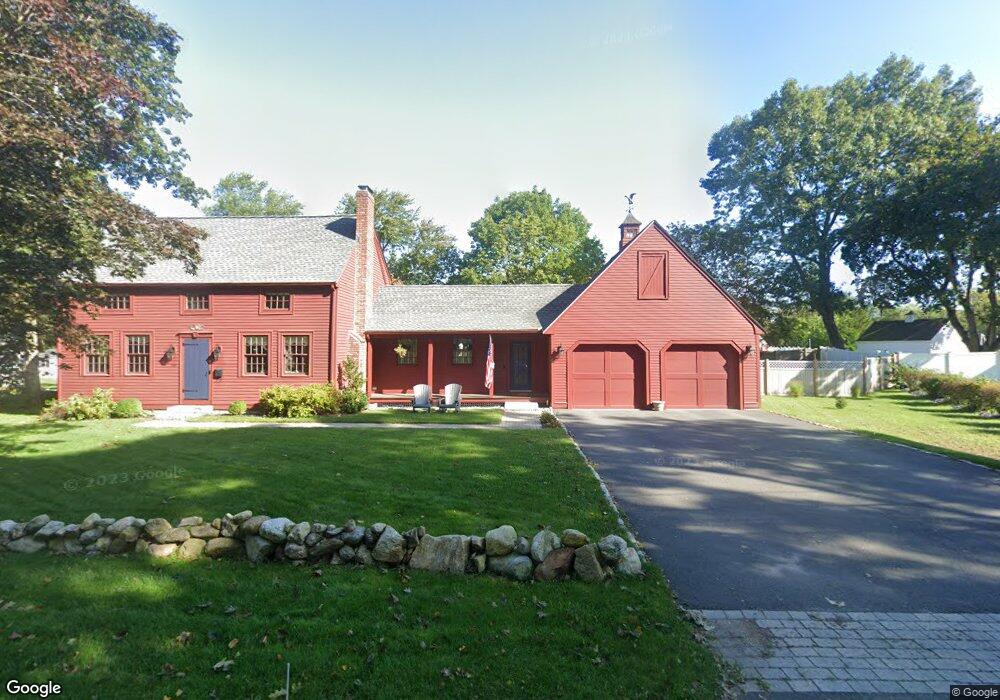
198 Summer St Andover, MA 01810
East Andover NeighborhoodEstimated Value: $995,081 - $1,162,000
4
Beds
2
Baths
1,656
Sq Ft
$641/Sq Ft
Est. Value
About This Home
This home is located at 198 Summer St, Andover, MA 01810 and is currently estimated at $1,061,770, approximately $641 per square foot. 198 Summer St is a home located in Essex County with nearby schools including Bancroft Elementary School, Doherty Middle School, and Andover High School.
Ownership History
Date
Name
Owned For
Owner Type
Purchase Details
Closed on
Jan 31, 2005
Sold by
Laporte Carol Ann
Bought by
Murphy Joseph D and Murphy Beth A
Current Estimated Value
Home Financials for this Owner
Home Financials are based on the most recent Mortgage that was taken out on this home.
Original Mortgage
$391,000
Outstanding Balance
$195,030
Interest Rate
5.67%
Mortgage Type
Purchase Money Mortgage
Estimated Equity
$866,740
Create a Home Valuation Report for This Property
The Home Valuation Report is an in-depth analysis detailing your home's value as well as a comparison with similar homes in the area
Home Values in the Area
Average Home Value in this Area
Purchase History
| Date | Buyer | Sale Price | Title Company |
|---|---|---|---|
| Murphy Joseph D | $440,000 | -- | |
| Murphy Joseph D | $440,000 | -- |
Source: Public Records
Mortgage History
| Date | Status | Borrower | Loan Amount |
|---|---|---|---|
| Open | Murphy Joseph D | $391,000 | |
| Closed | Murphy Joseph D | $391,000 |
Source: Public Records
Tax History
| Year | Tax Paid | Tax Assessment Tax Assessment Total Assessment is a certain percentage of the fair market value that is determined by local assessors to be the total taxable value of land and additions on the property. | Land | Improvement |
|---|---|---|---|---|
| 2024 | $10,975 | $852,100 | $509,200 | $342,900 |
| 2023 | $10,490 | $767,900 | $458,700 | $309,200 |
| 2022 | $9,946 | $681,200 | $405,900 | $275,300 |
| 2021 | $9,504 | $621,600 | $369,000 | $252,600 |
| 2020 | $8,706 | $580,000 | $360,000 | $220,000 |
| 2019 | $8,504 | $556,900 | $346,100 | $210,800 |
| 2018 | $8,123 | $519,400 | $326,300 | $193,100 |
| 2017 | $7,762 | $511,300 | $319,900 | $191,400 |
| 2016 | $7,577 | $511,300 | $319,900 | $191,400 |
| 2015 | $7,301 | $487,700 | $307,700 | $180,000 |
Source: Public Records
Map
Nearby Homes
- 15 Alcott Way
- 20-22 Florence St
- 33 Chestnut St Unit 2
- 100.5 Main St Unit Q
- 96 N Main St Unit 3
- 53 Salem St
- Lot 7 Weeping Willow Dr
- 124 Quail Run Rd
- 136 Quail Run Rd
- 67 High St
- 35 Peters St
- 5 Lewis St
- 1 Longwood Dr Unit 105
- 104 Salem St
- 22 Railroad St Unit 407
- 2 Powder Mill Square Unit 2B
- 2 Kingston St Unit 2
- 50C Washington Park Dr Unit 10
- 133B Salem
- 3 Torr St