198 Summer St Andover, MA 01810
East Andover NeighborhoodEstimated Value: $995,000 - $1,084,000
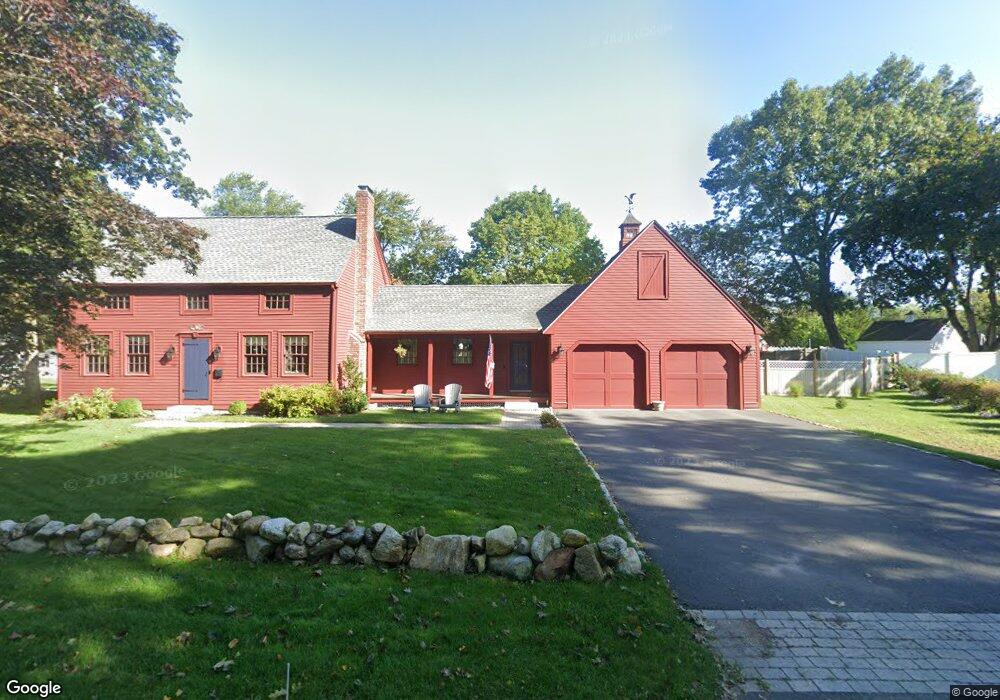
About This Home
This home is located at 198 Summer St, Andover, MA 01810 and is currently estimated at $1,040,695, approximately $628 per square foot. 198 Summer St is a home located in Essex County with nearby schools including Bancroft Elementary School, Doherty Middle School, and Andover High School.
Ownership History
We collect this data history from publicly available records. To have your information removed, we recommend requesting removal directly through your county’s website.
Purchase Details
Home Financials for this Owner
Home Financials are based on the most recent Mortgage that was taken out on this home.Home Values in the Area
Average Home Value in this Area
Purchase History
We collect this data history from publicly available records. To have your information removed, we recommend requesting removal directly through your county’s website.
| Date | Buyer | Sale Price | Title Company |
|---|---|---|---|
| $440,000 | -- | ||
| $440,000 | -- | ||
| $440,000 | -- |
Mortgage History
We collect this data history from publicly available records. To have your information removed, we recommend requesting removal directly through your county’s website.
| Date | Status | Borrower | Loan Amount |
|---|---|---|---|
| Open | $391,000 | ||
| Closed | $391,000 |
Tax History
We collect this data history from publicly available records. To have your information removed, we recommend requesting removal directly through your county’s website.
| Year | Tax Paid | Tax Assessment Tax Assessment Total Assessment is a certain percentage of the fair market value that is determined by local assessors to be the total taxable value of land and additions on the property. | Land | Improvement |
|---|---|---|---|---|
| 2025 | $11,739 | $939,900 | $555,800 | $384,100 |
| 2024 | $10,975 | $852,100 | $509,200 | $342,900 |
| 2023 | $10,490 | $767,900 | $458,700 | $309,200 |
| 2022 | $9,946 | $681,200 | $405,900 | $275,300 |
| 2021 | $9,504 | $621,600 | $369,000 | $252,600 |
| 2020 | $8,706 | $580,000 | $360,000 | $220,000 |
| 2019 | $8,504 | $556,900 | $346,100 | $210,800 |
| 2018 | $8,123 | $519,400 | $326,300 | $193,100 |
| 2017 | $7,762 | $511,300 | $319,900 | $191,400 |
| 2016 | $7,577 | $511,300 | $319,900 | $191,400 |
| 2015 | $7,301 | $487,700 | $307,700 | $180,000 |
Map
- 1 Rogers Brook E
- 324 Hillside Rd
- 4 Applecrest Rd
- 30 Bucklin Rd
- 625 Turnpike St
- 114 Chestnut St
- 9 Stratford Rd
- 115 Highland Rd
- 31 Pine St
- 60 Morton St Unit R
- 156 Elm St
- 202 Rosemont Dr
- 12 Burton Farm Dr
- 10 Wolcott Ave
- 13 Carmel Rd
- 33 Chestnut St Unit 2
- 19 Elm Ct
- 9 Elm Ct
- 58 Maple Ave Unit 58
- 10 Elm Ct
- 272 Highland Rd
- 195 Summer St
- 3 Rogers Brook E
- 268 Highland Rd
- 269 Highland Rd
- 191 Summer St
- 4 Rogers Brook E
- 265 Highland Rd
- 271 Highland Rd
- 187 Summer St
- 194 Summer St
- 266 Highland Rd
- 276 Highland Rd
- 4 Downing St
- 5 Rogers Brook E
- 190 Summer St
- 251 Highland Rd
- 6 Rogers Brook E
- 183 Summer St
- 6 Downing St
Ask me questions while you tour the home.