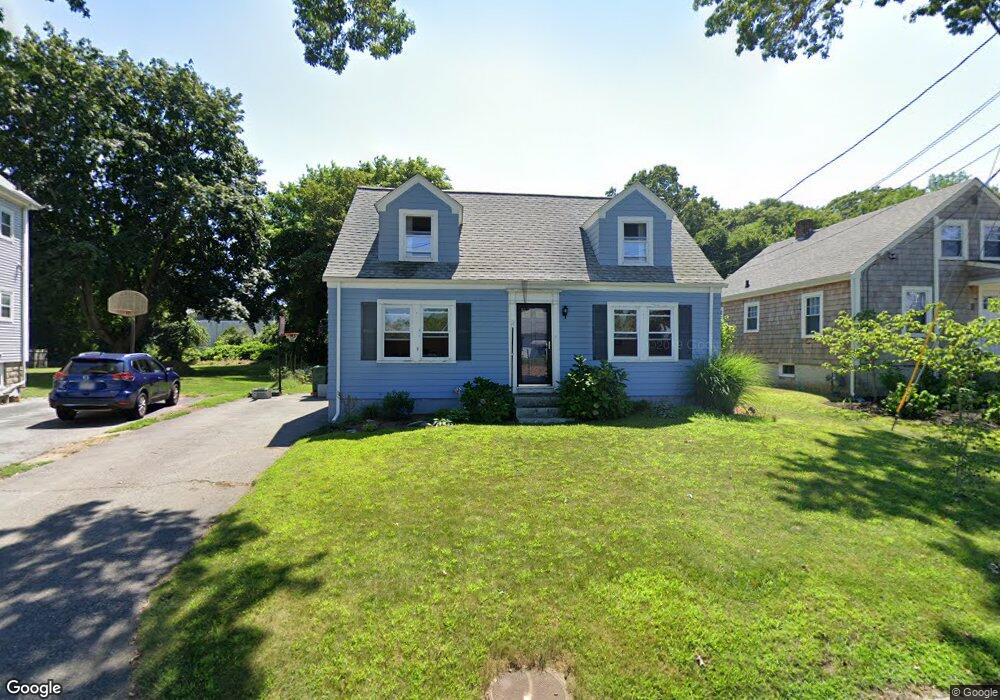
198 Waseca Ave Barrington, RI 02806
North Barrington NeighborhoodEstimated Value: $502,552 - $610,000
3
Beds
1
Bath
1,102
Sq Ft
$520/Sq Ft
Est. Value
About This Home
This home is located at 198 Waseca Ave, Barrington, RI 02806 and is currently estimated at $572,888, approximately $519 per square foot. 198 Waseca Ave is a home located in Bristol County with nearby schools including Barrington High School, Barrington Christian Academy, and St. Andrews School.
Ownership History
Date
Name
Owned For
Owner Type
Purchase Details
Closed on
May 28, 2010
Sold by
Martin Matthew and Girard Alysse
Bought by
Billingsley Jay A and Murrin Rose C
Current Estimated Value
Purchase Details
Closed on
Feb 12, 2006
Sold by
Stewart Jayne M
Bought by
Martin Matthew and Girard Alyssa
Purchase Details
Closed on
May 24, 2002
Sold by
Larisa Carlo and Larisa Philomena
Bought by
Stewart Robert J and Stewart Jayne
Create a Home Valuation Report for This Property
The Home Valuation Report is an in-depth analysis detailing your home's value as well as a comparison with similar homes in the area
Home Values in the Area
Average Home Value in this Area
Purchase History
| Date | Buyer | Sale Price | Title Company |
|---|---|---|---|
| Billingsley Jay A | $234,000 | -- | |
| Martin Matthew | $269,000 | -- | |
| Stewart Robert J | $170,000 | -- |
Source: Public Records
Mortgage History
| Date | Status | Borrower | Loan Amount |
|---|---|---|---|
| Open | Stewart Robert J | $210,000 | |
| Closed | Stewart Robert J | $214,310 |
Source: Public Records
Tax History
| Year | Tax Paid | Tax Assessment Tax Assessment Total Assessment is a certain percentage of the fair market value that is determined by local assessors to be the total taxable value of land and additions on the property. | Land | Improvement |
|---|---|---|---|---|
| 2025 | $6,535 | $426,000 | $216,000 | $210,000 |
| 2024 | $6,284 | $426,000 | $216,000 | $210,000 |
| 2023 | $5,786 | $285,000 | $124,000 | $161,000 |
| 2022 | $5,600 | $285,000 | $124,000 | $161,000 |
| 2021 | $5,458 | $285,000 | $124,000 | $161,000 |
| 2020 | $5,183 | $248,000 | $102,000 | $146,000 |
| 2019 | $4,985 | $248,000 | $102,000 | $146,000 |
| 2018 | $4,836 | $248,000 | $102,000 | $146,000 |
| 2017 | $4,770 | $238,500 | $96,600 | $141,900 |
| 2016 | $4,400 | $238,500 | $96,600 | $141,900 |
| 2015 | $4,353 | $238,500 | $96,600 | $141,900 |
| 2014 | $3,978 | $217,400 | $96,600 | $120,800 |
Source: Public Records
Map
Nearby Homes
Your Personal Tour Guide
Ask me questions while you tour the home.