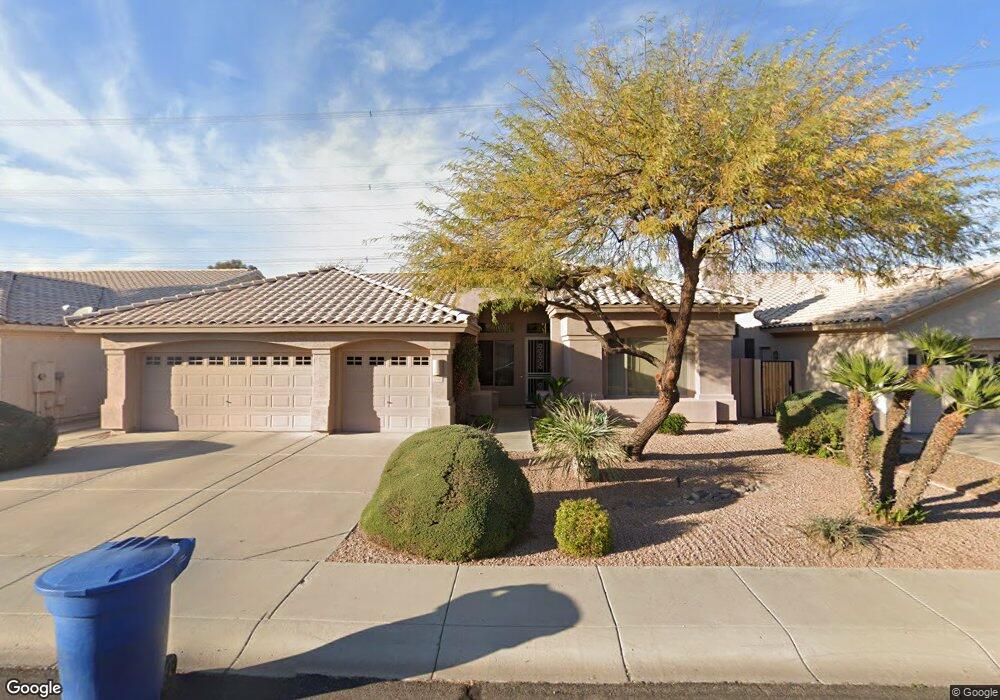
1980 E Divot Dr Tempe, AZ 85283
South Tempe NeighborhoodEstimated Value: $618,534 - $698,000
Studio
3
Baths
2,407
Sq Ft
$282/Sq Ft
Est. Value
About This Home
This home is located at 1980 E Divot Dr, Tempe, AZ 85283 and is currently estimated at $677,884, approximately $281 per square foot. 1980 E Divot Dr is a home located in Maricopa County with nearby schools including Kyrene de los Niños Elementary School, Kyrene del Norte School, and Kyrene Middle School.
Ownership History
Date
Name
Owned For
Owner Type
Purchase Details
Closed on
Aug 30, 2022
Sold by
Tanya Kne
Bought by
Tanya Kne Revocable Trust
Current Estimated Value
Purchase Details
Closed on
May 29, 2014
Sold by
Risoli Angie Raganit
Bought by
Risoli Ralph
Purchase Details
Closed on
Jul 12, 1999
Sold by
Walek Charles A and Walek Roxanne L
Bought by
Kne Tanya
Home Financials for this Owner
Home Financials are based on the most recent Mortgage that was taken out on this home.
Original Mortgage
$180,800
Interest Rate
7.64%
Mortgage Type
New Conventional
Purchase Details
Closed on
Aug 23, 1995
Sold by
Fulton Homes Corp
Bought by
Walek Charles A and Walek Roxanne L
Home Financials for this Owner
Home Financials are based on the most recent Mortgage that was taken out on this home.
Original Mortgage
$149,350
Interest Rate
7.63%
Mortgage Type
VA
Create a Home Valuation Report for This Property
The Home Valuation Report is an in-depth analysis detailing your home's value as well as a comparison with similar homes in the area
Home Values in the Area
Average Home Value in this Area
Purchase History
| Date | Buyer | Sale Price | Title Company |
|---|---|---|---|
| Tanya Kne Revocable Trust | -- | -- | |
| Risoli Ralph | -- | Pioneer Title Agency Inc | |
| Kne Tanya | $226,000 | Capital Title Agency | |
| Walek Charles A | $145,000 | Security Title Agency |
Source: Public Records
Mortgage History
| Date | Status | Borrower | Loan Amount |
|---|---|---|---|
| Previous Owner | Kne Tanya | $180,800 | |
| Previous Owner | Walek Charles A | $149,350 |
Source: Public Records
Tax History
| Year | Tax Paid | Tax Assessment Tax Assessment Total Assessment is a certain percentage of the fair market value that is determined by local assessors to be the total taxable value of land and additions on the property. | Land | Improvement |
|---|---|---|---|---|
| 2025 | $4,148 | $43,539 | -- | -- |
| 2024 | $3,890 | $41,466 | -- | -- |
| 2023 | $3,890 | $50,720 | $10,140 | $40,580 |
| 2022 | $3,681 | $38,580 | $7,710 | $30,870 |
| 2021 | $3,779 | $35,820 | $7,160 | $28,660 |
| 2020 | $3,703 | $34,770 | $6,950 | $27,820 |
| 2019 | $3,586 | $33,260 | $6,650 | $26,610 |
| 2018 | $3,465 | $31,060 | $6,210 | $24,850 |
| 2017 | $3,428 | $31,880 | $6,370 | $25,510 |
| 2016 | $3,476 | $32,700 | $6,540 | $26,160 |
| 2015 | $3,211 | $29,770 | $5,950 | $23,820 |
Source: Public Records
Map
Nearby Homes
- 1943 E Diamond Dr
- 1938 E Diamond Dr
- 2031 E Vaughn St
- 6517 S Hazelton Ln
- 1960 E Krista Way
- 1861 E Sunburst Ln
- 6411 S River Dr Unit 6
- 1861 E Krista Way
- 2021 E Pegasus Dr
- 2901 W Straford Dr
- 1947 E Orion St
- 7715 S Alder Dr
- 6320 S Shannon Dr Unit 9
- 6815 S Juniper St
- 1915 E Gemini Dr Unit 6
- 1927 E Velvet Dr
- 6008 S Mcclintock Dr
- 1914 E Citation Ln
- 1455 E Brentrup Dr
- 2642 W Onza Ave
- 1976 E Divot Dr
- 1984 E Divot Dr
- 1972 E Divot Dr
- 1988 E Divot Dr
- 1973 E Divot Dr
- 1977 E Divot Dr
- 1969 E Divot Dr
- 1968 E Divot Dr
- 1981 E Divot Dr
- 1965 E Divot Dr
- 1964 E Divot Dr
- 1974 E Drake Dr
- 1978 E Drake Dr
- 1961 E Divot Dr
- 1982 E Drake Dr
- 1962 E Drake Dr
- 1960 E Divot Dr
- 1957 E Divot Dr
- 1947 E Diamond Dr
- 1958 E Drake Dr
Your Personal Tour Guide
Ask me questions while you tour the home.