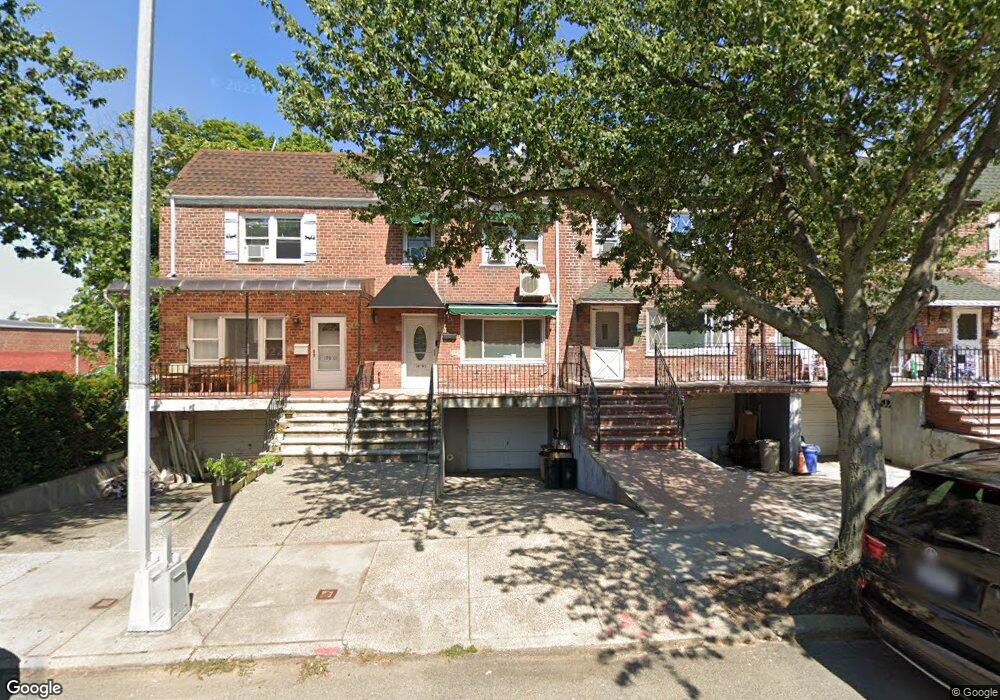
19805 30th Ave Flushing, NY 11358
Auburndale NeighborhoodEstimated Value: $888,513 - $969,000
3
Beds
1
Bath
1,368
Sq Ft
$670/Sq Ft
Est. Value
About This Home
This home is located at 19805 30th Ave, Flushing, NY 11358 and is currently estimated at $916,128, approximately $669 per square foot. 19805 30th Ave is a home located in Queens County with nearby schools including P.S. 159 Queens, I.S. 25 Adrien Block, and Bayside High School.
Ownership History
Date
Name
Owned For
Owner Type
Purchase Details
Closed on
Aug 2, 2016
Sold by
Kim Sun Hi
Bought by
Lin Hang and Lin Jian Ping
Current Estimated Value
Home Financials for this Owner
Home Financials are based on the most recent Mortgage that was taken out on this home.
Original Mortgage
$375,000
Outstanding Balance
$296,892
Interest Rate
3.41%
Mortgage Type
New Conventional
Estimated Equity
$619,236
Purchase Details
Closed on
Sep 30, 2005
Sold by
Sokolovsky Ana
Bought by
Kim Sun Hi
Home Financials for this Owner
Home Financials are based on the most recent Mortgage that was taken out on this home.
Original Mortgage
$200,000
Interest Rate
5.78%
Mortgage Type
Purchase Money Mortgage
Purchase Details
Closed on
Jan 22, 2003
Sold by
Sokolovsky Ana and Sokolovsky Ivo
Bought by
Sokolovsky Ana
Create a Home Valuation Report for This Property
The Home Valuation Report is an in-depth analysis detailing your home's value as well as a comparison with similar homes in the area
Home Values in the Area
Average Home Value in this Area
Purchase History
| Date | Buyer | Sale Price | Title Company |
|---|---|---|---|
| Lin Hang | $675,000 | -- | |
| Lin Hang | $675,000 | -- | |
| Lin Hang | $675,000 | -- | |
| Kim Sun Hi | $495,000 | -- | |
| Kim Sun Hi | $495,000 | -- | |
| Sokolovsky Ana | -- | -- | |
| Sokolovsky Ana | -- | -- |
Source: Public Records
Mortgage History
| Date | Status | Borrower | Loan Amount |
|---|---|---|---|
| Open | Lin Hang | $375,000 | |
| Closed | Lin Hang | $375,000 | |
| Previous Owner | Kim Sun Hi | $200,000 |
Source: Public Records
Tax History
| Year | Tax Paid | Tax Assessment Tax Assessment Total Assessment is a certain percentage of the fair market value that is determined by local assessors to be the total taxable value of land and additions on the property. | Land | Improvement |
|---|---|---|---|---|
| 2025 | $7,856 | $41,460 | $6,825 | $34,635 |
| 2024 | $7,856 | $39,114 | $7,008 | $32,106 |
| 2023 | $7,476 | $37,224 | $6,246 | $30,978 |
| 2022 | $7,431 | $53,340 | $8,880 | $44,460 |
| 2021 | $7,707 | $57,060 | $8,880 | $48,180 |
| 2020 | $7,313 | $51,000 | $8,880 | $42,120 |
| 2019 | $6,819 | $50,100 | $8,880 | $41,220 |
| 2018 | $6,323 | $31,020 | $6,521 | $24,499 |
| 2017 | $6,323 | $31,020 | $7,970 | $23,050 |
| 2016 | $6,101 | $31,020 | $7,970 | $23,050 |
| 2015 | $3,529 | $28,792 | $8,453 | $20,339 |
| 2014 | $3,529 | $27,163 | $9,536 | $17,627 |
Source: Public Records
Map
Nearby Homes
- 3228 Utopia Pkwy
- 28-07 172nd St
- 29-31 170th St
- 32-28 202nd St
- 3227 202nd St
- 201-05 28th Ave
- 34-12 192nd St
- 29 Avenue
- 29-37 168th St
- 20206 33rd Ave
- 27-25 168th St
- 3226 204th St
- 200-14 34th Ave
- 199-27 26th Ave
- 3314 204th St
- 200-33 26th Ave
- 32-16 167th St
- 2533 Francis Lewis Blvd
- 204-11 34th Ave
- 2724 166th St
- 198-5 30th Ave
- 19807 30th Ave
- 19805 30th Ave
- 19801 30th Ave
- 19801 30th Ave
- 198-7 30th Ave
- 19807 30th Ave
- 19809 30th Ave
- 19809 30th Ave
- 19809 30th Ave
- 19811 30th Ave
- 19811 30th Ave
- 198-11 30th Ave
- 19819 30th Ave
- 3001 Francis Lewis Blvd
- 30-05 Francis Lewis Blvd Unit 3
- 30-05 Francis Lewis Blvd Unit 1
- 30-05 Francis Lewis Blvd Unit 2
- 30-05 Francis Lewis Blvd
- 2909 Utopia Pkwy
Your Personal Tour Guide
Ask me questions while you tour the home.