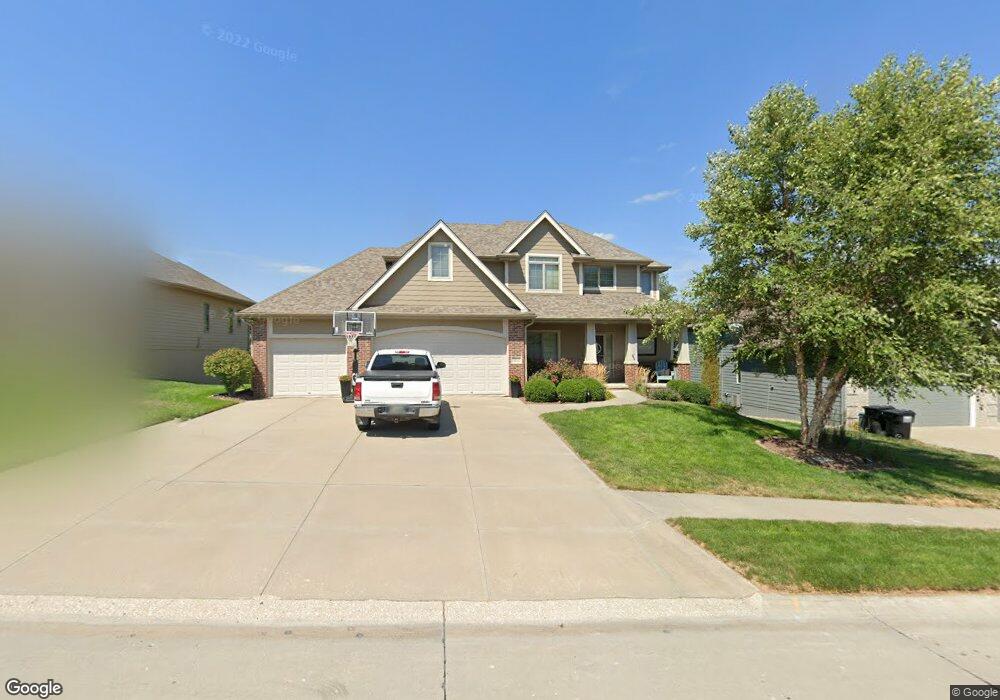
19814 Maple St Gretna, NE 68028
Estimated Value: $457,202 - $514,000
4
Beds
3
Baths
2,219
Sq Ft
$221/Sq Ft
Est. Value
About This Home
This home is located at 19814 Maple St, Gretna, NE 68028 and is currently estimated at $491,051, approximately $221 per square foot. 19814 Maple St is a home located in Sarpy County with nearby schools including Squire John Thomas Elementary School, Gretna Middle School, and Gretna High School.
Ownership History
Date
Name
Owned For
Owner Type
Purchase Details
Closed on
Aug 18, 2009
Sold by
Home Building Consultants Inc
Bought by
Mahrt Justin R and Mahrt Kimberly A
Current Estimated Value
Home Financials for this Owner
Home Financials are based on the most recent Mortgage that was taken out on this home.
Original Mortgage
$165,000
Outstanding Balance
$107,471
Interest Rate
5.19%
Estimated Equity
$383,580
Purchase Details
Closed on
Mar 24, 2009
Sold by
Mccune Development Llc
Bought by
Home Building Consultants Inc
Home Financials for this Owner
Home Financials are based on the most recent Mortgage that was taken out on this home.
Original Mortgage
$215,920
Interest Rate
5.21%
Mortgage Type
Small Business Administration
Create a Home Valuation Report for This Property
The Home Valuation Report is an in-depth analysis detailing your home's value as well as a comparison with similar homes in the area
Home Values in the Area
Average Home Value in this Area
Purchase History
| Date | Buyer | Sale Price | Title Company |
|---|---|---|---|
| Mahrt Justin R | $274,000 | Superior Title & Escrow Llc | |
| Home Building Consultants Inc | $33,000 | None Available |
Source: Public Records
Mortgage History
| Date | Status | Borrower | Loan Amount |
|---|---|---|---|
| Open | Mahrt Justin R | $165,000 | |
| Previous Owner | Home Building Consultants Inc | $215,920 |
Source: Public Records
Tax History
| Year | Tax Paid | Tax Assessment Tax Assessment Total Assessment is a certain percentage of the fair market value that is determined by local assessors to be the total taxable value of land and additions on the property. | Land | Improvement |
|---|---|---|---|---|
| 2025 | $8,287 | $466,458 | $76,000 | $390,458 |
| 2024 | $8,330 | $458,391 | $70,000 | $388,391 |
| 2023 | $8,330 | $387,554 | $50,000 | $337,554 |
| 2022 | $7,961 | $348,849 | $45,000 | $303,849 |
| 2021 | $5,931 | $323,728 | $40,000 | $283,728 |
| 2020 | $8,308 | $316,976 | $40,000 | $276,976 |
| 2019 | $8,447 | $311,044 | $38,000 | $273,044 |
| 2018 | $8,481 | $308,025 | $38,000 | $270,025 |
| 2017 | $8,272 | $299,924 | $38,000 | $261,924 |
| 2016 | $7,913 | $288,033 | $38,000 | $250,033 |
| 2015 | $7,715 | $282,410 | $35,000 | $247,410 |
| 2014 | $7,593 | $279,771 | $35,000 | $244,771 |
| 2012 | -- | $270,394 | $35,000 | $235,394 |
Source: Public Records
Map
Nearby Homes
- 19902 Ash St
- 516 Sherwood Dr
- 19803 Birch St
- 19910 Oak St
- 434 Devonshire Dr
- 449 Brentwood Dr
- 11610 S 202nd St
- 410 Sherwood Dr
- 11884 Lewison Ln
- 12065 Iva St
- 230 Sycamore Cir
- 11606 S 191st Ave
- 11617 S 191st Ave
- 21707 Glenmore Dr
- 21711 Glenmore Dr
- 20404 Woodridge Dr
- 19120 Murray Trail
- 11657 S 209th St
- 19122 Fir St
- 11515 S 191st St
- 19810 Maple St
- 19816 Maple St
- 19820 Maple St
- 19806 Maple St
- 19815 Sherwood Cir
- 19811 Sherwood Cir
- 19811 Maple St
- 19807 Maple St
- 19815 Maple St
- 19904 Maple St
- 19803 Maple St
- 19903 Sherwood Cir
- 19802 Maple St
- 19901 Maple St
- 19908 Maple St
- 19808 Sherwood Cir
- 19812 Ash St
- 11603 S 198th St
- 19907 Sherwood Cir
- 19808 Ash St
Your Personal Tour Guide
Ask me questions while you tour the home.