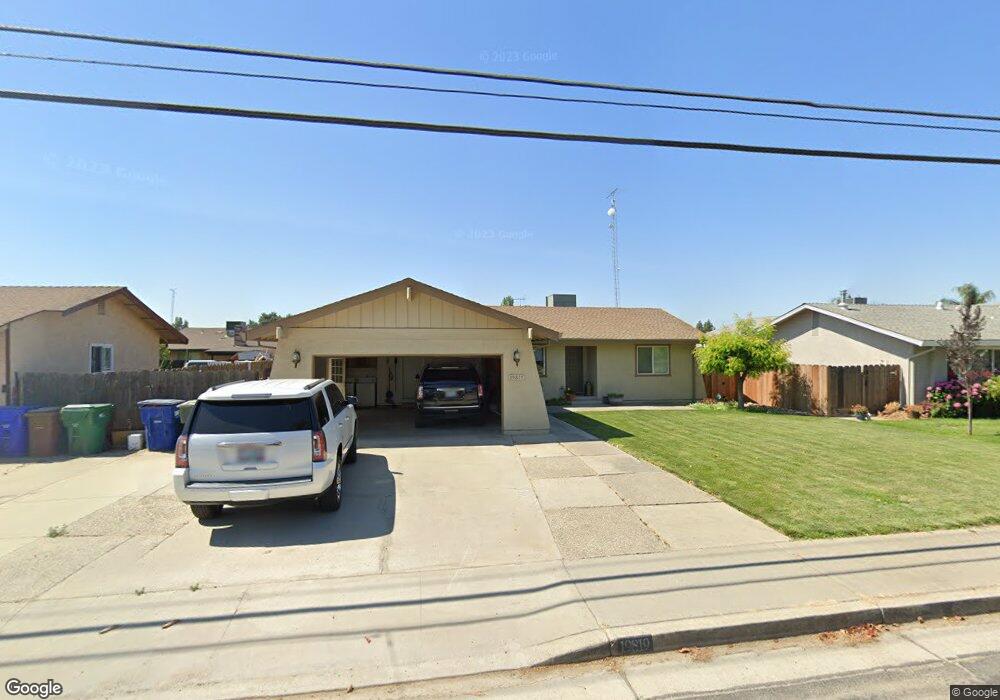
19819 American Ave Hilmar, CA 95324
Hilmar-Irwin NeighborhoodEstimated Value: $353,000 - $421,783
3
Beds
2
Baths
1,259
Sq Ft
$305/Sq Ft
Est. Value
About This Home
This home is located at 19819 American Ave, Hilmar, CA 95324 and is currently estimated at $384,196, approximately $305 per square foot. 19819 American Ave is a home located in Merced County with nearby schools including Hilmar High School.
Ownership History
Date
Name
Owned For
Owner Type
Purchase Details
Closed on
Jul 3, 2008
Sold by
Lourenco Jose G and Lourenco Maria A
Bought by
Lourenco Jose G and Lourenco Maria A
Current Estimated Value
Purchase Details
Closed on
Mar 18, 2008
Sold by
Avelo Mortgage Llc
Bought by
Lourenco Jose G and Lourenco Maria A
Purchase Details
Closed on
Dec 1, 2007
Sold by
Olague Jose
Bought by
Avelo Mortgage Llc
Purchase Details
Closed on
Jan 7, 2004
Sold by
Guerrero Yedid
Bought by
Olague Jose
Home Financials for this Owner
Home Financials are based on the most recent Mortgage that was taken out on this home.
Original Mortgage
$180,000
Interest Rate
6.02%
Mortgage Type
Purchase Money Mortgage
Purchase Details
Closed on
Jul 10, 2002
Sold by
Morosa Neil
Bought by
Guerrero Yedid and Olague Jose
Home Financials for this Owner
Home Financials are based on the most recent Mortgage that was taken out on this home.
Original Mortgage
$163,922
Interest Rate
6.69%
Mortgage Type
FHA
Create a Home Valuation Report for This Property
The Home Valuation Report is an in-depth analysis detailing your home's value as well as a comparison with similar homes in the area
Home Values in the Area
Average Home Value in this Area
Purchase History
| Date | Buyer | Sale Price | Title Company |
|---|---|---|---|
| Lourenco Jose G | -- | None Available | |
| Lourenco Jose G | $175,000 | Lsi Title | |
| Avelo Mortgage Llc | $189,900 | Accommodation | |
| Olague Jose | $90,000 | Chicago Title Company | |
| Guerrero Yedid | $170,000 | Alliance Title Company |
Source: Public Records
Mortgage History
| Date | Status | Borrower | Loan Amount |
|---|---|---|---|
| Previous Owner | Olague Jose | $180,000 | |
| Previous Owner | Guerrero Yedid | $163,922 | |
| Closed | Guerrero Yedid | $10,197 |
Source: Public Records
Tax History Compared to Growth
Tax History
| Year | Tax Paid | Tax Assessment Tax Assessment Total Assessment is a certain percentage of the fair market value that is determined by local assessors to be the total taxable value of land and additions on the property. | Land | Improvement |
|---|---|---|---|---|
| 2025 | $2,497 | $229,849 | $118,208 | $111,641 |
| 2024 | $2,497 | $225,343 | $115,891 | $109,452 |
| 2023 | $2,429 | $220,925 | $113,619 | $107,306 |
| 2022 | $2,396 | $216,594 | $111,392 | $105,202 |
| 2021 | $2,357 | $212,348 | $109,208 | $103,140 |
| 2020 | $2,346 | $210,172 | $108,089 | $102,083 |
| 2019 | $2,326 | $206,052 | $105,970 | $100,082 |
| 2018 | $2,137 | $202,013 | $103,893 | $98,120 |
| 2017 | $2,091 | $198,053 | $101,856 | $96,197 |
| 2016 | $2,050 | $194,170 | $99,859 | $94,311 |
| 2015 | $2,026 | $191,255 | $98,360 | $92,895 |
| 2014 | $1,979 | $187,510 | $96,434 | $91,076 |
Source: Public Records
Map
Nearby Homes
- 19960 American Ave Unit 35
- 19960 American Ave Unit 9
- 19960 American Ave Unit 36
- 19960 American Ave
- 19667 American Ave Unit 61
- 8684 N Privado Ct
- 8712 N Privado Ct
- 8291 Bridgeport Dr
- 0 1st St Unit 224093409
- 0 1st St Unit 224093393
- 8738 N Bellagio Dr
- 7940 Lander Ave
- 7859 Kent Ct
- 19950 Campbell St
- 20378 Amethyst Dr
- 8139 Winfield Dr
- 20443 Songbird Way
- 19987 Campbell St
- 8077 Winfield Dr
- 7775 Klint Dr
- 19807 American Ave
- 19833 American Ave
- 19822 Patricia Ln
- 19810 Patricia Ln
- 19834 Patricia Ln
- 19845 American Ave
- 19795 American Ave
- 19796 Patricia Ln
- 19846 Patricia Ln
- 19818 American Ave
- 19840 American Ave
- 19859 American Ave
- 19781 American Ave
- 19784 Patricia Ln
- 19790 American Ave
- 19790 American Ave
- 19860 Patricia Ln
- 19823 Patricia Ln
- 19811 Patricia Ln
- 19873 American Ave