Estimated Value: $570,000 - $611,000
4
Beds
4
Baths
2,602
Sq Ft
$229/Sq Ft
Est. Value
About This Home
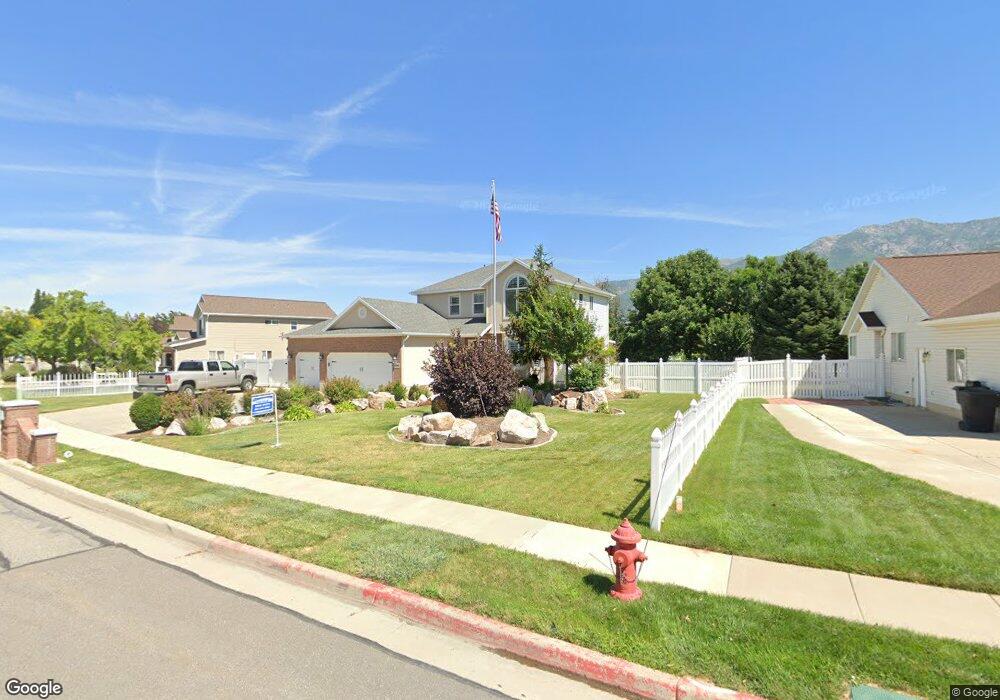
This home is located at 1982 Cedar Loop Dr, Ogden, UT 84405 and is currently estimated at $595,313, approximately $228 per square foot. 1982 Cedar Loop Dr is a home located in Davis County with nearby schools including South Weber Elementary School, Sunset Junior High School, and Northridge High School.
Ownership History
Date
Name
Owned For
Owner Type
Purchase Details
Closed on
Sep 5, 2023
Sold by
Patt Travis W and Patt Whitney L
Bought by
Cover Allen and Cover Laura
Current Estimated Value
Purchase Details
Closed on
Feb 12, 2020
Sold by
Patt Travis Wayne and Patt Whitney Lynne
Bought by
Patt Travis W and Patt Whitney L
Home Financials for this Owner
Home Financials are based on the most recent Mortgage that was taken out on this home.
Original Mortgage
$317,600
Interest Rate
3.72%
Mortgage Type
VA
Purchase Details
Closed on
May 23, 2019
Sold by
Abbott Bruce and Abbott Karen
Bought by
Patt Travis Wayne and Patt Whitney Lynne
Home Financials for this Owner
Home Financials are based on the most recent Mortgage that was taken out on this home.
Original Mortgage
$314,650
Interest Rate
4.1%
Mortgage Type
VA
Purchase Details
Closed on
Oct 7, 2004
Sold by
King Stewart Dean
Bought by
King Stewart and King Kimber
Home Financials for this Owner
Home Financials are based on the most recent Mortgage that was taken out on this home.
Original Mortgage
$151,000
Interest Rate
5.77%
Mortgage Type
Purchase Money Mortgage
Purchase Details
Closed on
Oct 6, 2004
Sold by
Federal National Mortgage Association
Bought by
King Stewart Dean
Home Financials for this Owner
Home Financials are based on the most recent Mortgage that was taken out on this home.
Original Mortgage
$151,000
Interest Rate
5.77%
Mortgage Type
Purchase Money Mortgage
Purchase Details
Closed on
Aug 24, 2004
Sold by
Bank Of America Na
Bought by
Federal National Mortgage Association
Home Financials for this Owner
Home Financials are based on the most recent Mortgage that was taken out on this home.
Original Mortgage
$151,000
Interest Rate
5.77%
Mortgage Type
Purchase Money Mortgage
Purchase Details
Closed on
Aug 27, 2003
Sold by
Hipwell Tyrone and Hipwell Lindsey
Bought by
Monge Siboney A
Purchase Details
Closed on
Dec 17, 1998
Sold by
Nilson & Company Inc
Bought by
Hipwell Tyrone and Hipwell Lindsey
Home Financials for this Owner
Home Financials are based on the most recent Mortgage that was taken out on this home.
Original Mortgage
$175,300
Interest Rate
6.86%
Purchase Details
Closed on
Jun 30, 1998
Sold by
Nilson & Company Inc
Bought by
Hipwell Tyron and Hipwell Lindsey
Purchase Details
Closed on
Sep 8, 1997
Sold by
U S Development Inc
Bought by
Nilson & Company Inc and Nilson Homes
Home Financials for this Owner
Home Financials are based on the most recent Mortgage that was taken out on this home.
Original Mortgage
$31,040
Interest Rate
7.42%
Create a Home Valuation Report for This Property
The Home Valuation Report is an in-depth analysis detailing your home's value as well as a comparison with similar homes in the area
Purchase History
| Date | Buyer | Sale Price | Title Company |
|---|---|---|---|
| Cover Allen | -- | First American Title Insurance | |
| Patt Travis W | -- | Backman Title Service | |
| Patt Travis Wayne | -- | First American Title | |
| King Stewart | -- | Us Title Of Utah | |
| King Stewart Dean | $190,000 | Us Title Of Utah | |
| Federal National Mortgage Association | -- | -- | |
| Bank Of America Na | $177,332 | Inwest Title Services Inc | |
| Monge Siboney A | $42,500 | Backman Stewart Title Servic | |
| Hipwell Tyrone | -- | Bonneville Title Company Inc | |
| Hipwell Tyron | -- | Bonneville Title Company Inc | |
| Nilson & Company Inc | -- | Bonneville Title Company Inc |
Source: Public Records
Mortgage History
| Date | Status | Borrower | Loan Amount |
|---|---|---|---|
| Previous Owner | Patt Travis W | $317,600 | |
| Previous Owner | Patt Travis Wayne | $314,650 | |
| Previous Owner | King Stewart Dean | $151,000 | |
| Previous Owner | Hipwell Tyrone | $175,300 | |
| Previous Owner | Nilson & Company Inc | $31,040 |
Source: Public Records
Tax History
| Year | Tax Paid | Tax Assessment Tax Assessment Total Assessment is a certain percentage of the fair market value that is determined by local assessors to be the total taxable value of land and additions on the property. | Land | Improvement |
|---|---|---|---|---|
| 2025 | $3,361 | $300,300 | $121,840 | $178,460 |
| 2024 | $3,149 | $285,450 | $98,647 | $186,803 |
| 2023 | $3,081 | $510,000 | $160,098 | $349,902 |
| 2022 | $3,241 | $303,050 | $77,460 | $225,590 |
| 2021 | $2,601 | $401,000 | $116,493 | $284,507 |
| 2020 | $2,337 | $351,000 | $108,818 | $242,182 |
| 2019 | $2,128 | $312,000 | $106,250 | $205,750 |
| 2018 | $2,115 | $290,000 | $98,109 | $191,891 |
| 2016 | $2,014 | $143,330 | $40,029 | $103,301 |
| 2015 | $1,767 | $133,265 | $40,029 | $93,236 |
| 2014 | $1,825 | $141,508 | $46,010 | $95,498 |
| 2013 | -- | $108,463 | $33,494 | $74,969 |
Source: Public Records
Map
Nearby Homes
- 7886 S 2100 E
- 2357 E 8100 S
- 7478 1980 E
- 7841 Peachwood Dr
- 1873 E 7600 S
- 2586 Deer Run Dr
- 8036 S 2575 E
- 7212 S Harolds Way
- 7897 S 2700 E Unit 303
- 7897 S 2700 E Unit 305
- 2765 E 7825 S
- 1458 E South Weber Dr
- 1577 E South Weber Dr Unit 3
- 2772 E 3575 N
- 3232 N Redtail Way
- 3087 N 2250 E
- 3142 N 1675 E
- 7484 S 1160 E Unit 1
- 1827 E Whitetail Dr
- 1809 E Whitetail Dr
- 1970 Cedar Loop Dr
- 1994 Cedar Loop Dr
- 7847 S 2000 E
- 7835 S 2000 E
- 1962 Cedar Loop Dr
- 1971 Cedar Loop Dr
- 2012 Cedar Loop Dr
- 1991 Cedar Loop Dr
- 1967 Cedar Loop Dr
- 7868 S 1960 E
- 1961 Cedar Loop Dr
- 7848 S 2000 E
- 7825 S 2000 E
- 1958 Cedar Loop Dr
- 2005 Cedar Loop Dr
- 2020 Cedar Loop Dr
- 7874 S 1960 E
- 2017 E Cedar Loop Dr
- 7832 S 2000 E
- 7840 S 2000 E
Your Personal Tour Guide
Ask me questions while you tour the home.