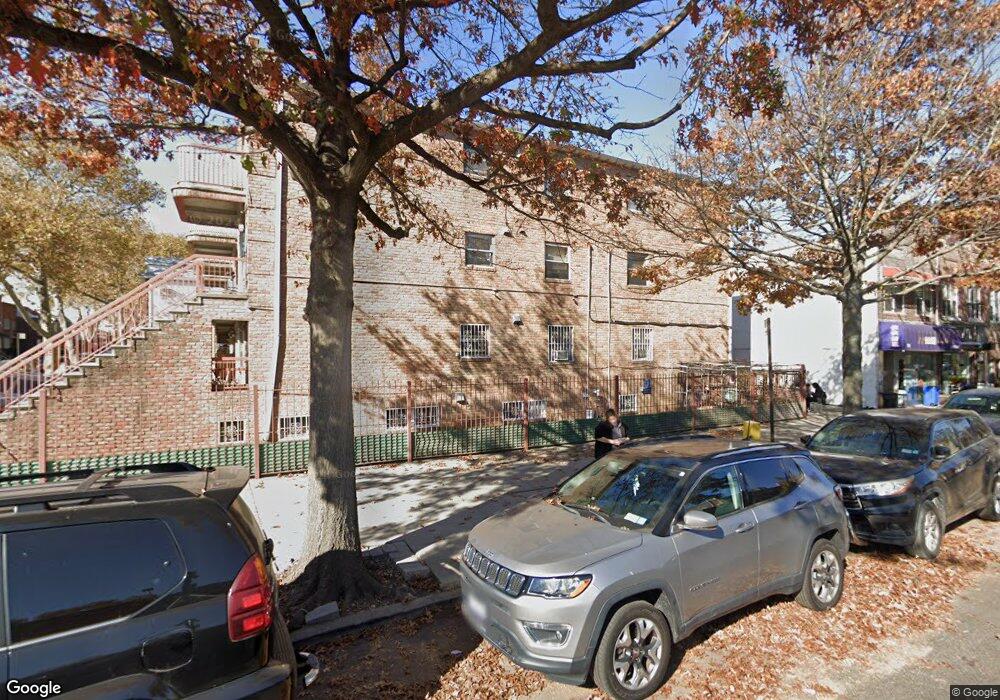
1983 73rd St Brooklyn, NY 11204
Bensonhurst NeighborhoodEstimated Value: $1,615,000 - $1,855,000
--
Bed
--
Bath
3,714
Sq Ft
$457/Sq Ft
Est. Value
About This Home
This home is located at 1983 73rd St, Brooklyn, NY 11204 and is currently estimated at $1,698,333, approximately $457 per square foot. 1983 73rd St is a home located in Kings County with nearby schools including P.S. 186 Dr. Irving A. Gladstone Elementary School, Seth Low Intermediate School 96, and New Utrecht High School.
Ownership History
Date
Name
Owned For
Owner Type
Purchase Details
Closed on
Sep 30, 2015
Sold by
Chu Jeff Kwok Ho
Bought by
Chu Jeff Kwok Ho and Flynn Yandy
Current Estimated Value
Purchase Details
Closed on
Oct 6, 2000
Sold by
Castle G L Enterprises Inc
Bought by
Ye Xue Yan and Ye Tian Mao
Home Financials for this Owner
Home Financials are based on the most recent Mortgage that was taken out on this home.
Original Mortgage
$300,000
Interest Rate
7.78%
Create a Home Valuation Report for This Property
The Home Valuation Report is an in-depth analysis detailing your home's value as well as a comparison with similar homes in the area
Home Values in the Area
Average Home Value in this Area
Purchase History
| Date | Buyer | Sale Price | Title Company |
|---|---|---|---|
| Chu Jeff Kwok Ho | -- | -- | |
| Ye Xue Yan | $520,000 | -- |
Source: Public Records
Mortgage History
| Date | Status | Borrower | Loan Amount |
|---|---|---|---|
| Previous Owner | Ye Xue Yan | $300,000 |
Source: Public Records
Tax History Compared to Growth
Tax History
| Year | Tax Paid | Tax Assessment Tax Assessment Total Assessment is a certain percentage of the fair market value that is determined by local assessors to be the total taxable value of land and additions on the property. | Land | Improvement |
|---|---|---|---|---|
| 2025 | $14,849 | $115,860 | $22,620 | $93,240 |
| 2024 | $14,849 | $136,320 | $22,620 | $113,700 |
| 2023 | $14,554 | $120,180 | $22,620 | $97,560 |
| 2022 | $13,841 | $108,840 | $22,620 | $86,220 |
| 2021 | $13,766 | $106,500 | $22,620 | $83,880 |
| 2020 | $10,311 | $93,180 | $22,620 | $70,560 |
| 2019 | $12,864 | $93,180 | $22,620 | $70,560 |
| 2018 | $12,174 | $59,719 | $12,895 | $46,824 |
| 2017 | $11,778 | $57,777 | $11,736 | $46,041 |
| 2016 | $10,897 | $54,508 | $14,192 | $40,316 |
| 2015 | $6,354 | $51,424 | $17,376 | $34,048 |
| 2014 | $6,354 | $51,340 | $14,744 | $36,596 |
Source: Public Records
Map
Nearby Homes