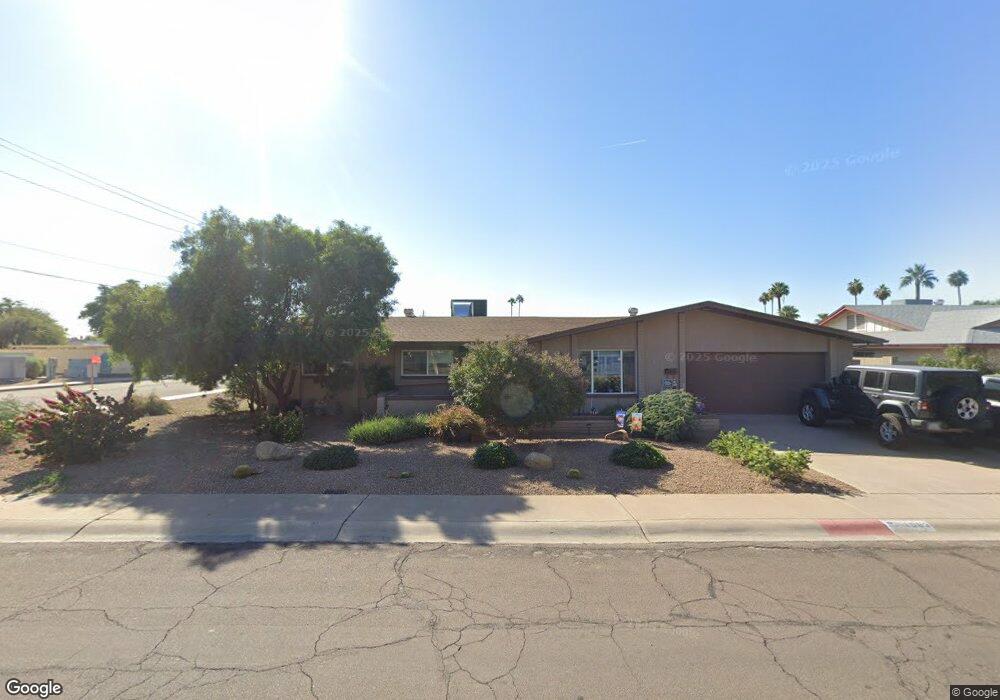
1983 E Meadow Dr Tempe, AZ 85282
Alameda NeighborhoodEstimated Value: $462,808 - $520,000
Studio
1
Bath
1,780
Sq Ft
$279/Sq Ft
Est. Value
About This Home
This home is located at 1983 E Meadow Dr, Tempe, AZ 85282 and is currently estimated at $496,702, approximately $279 per square foot. 1983 E Meadow Dr is a home located in Maricopa County with nearby schools including Curry Elementary School, Connolly Middle School, and McClintock High School.
Ownership History
Date
Name
Owned For
Owner Type
Purchase Details
Closed on
Aug 26, 2015
Sold by
Bevil Connie L
Bought by
Bevil Connie L and The Connie L Bevil Family Livi
Current Estimated Value
Purchase Details
Closed on
Oct 8, 2013
Sold by
Bevil Connie L and Bevil Connie
Bought by
Bevil Connie L
Home Financials for this Owner
Home Financials are based on the most recent Mortgage that was taken out on this home.
Original Mortgage
$145,500
Outstanding Balance
$109,544
Interest Rate
4.55%
Mortgage Type
New Conventional
Estimated Equity
$387,158
Purchase Details
Closed on
Mar 23, 1994
Sold by
Wozniak Dennis A and Wozniak Patricia A
Bought by
Bevil Connie L
Home Financials for this Owner
Home Financials are based on the most recent Mortgage that was taken out on this home.
Original Mortgage
$99,960
Interest Rate
8.52%
Mortgage Type
VA
Create a Home Valuation Report for This Property
The Home Valuation Report is an in-depth analysis detailing your home's value as well as a comparison with similar homes in the area
Home Values in the Area
Average Home Value in this Area
Purchase History
| Date | Buyer | Sale Price | Title Company |
|---|---|---|---|
| Bevil Connie L | -- | None Available | |
| Bevil Connie L | -- | None Available | |
| Bevil Connie L | $98,000 | United Title Agency |
Source: Public Records
Mortgage History
| Date | Status | Borrower | Loan Amount |
|---|---|---|---|
| Open | Bevil Connie L | $145,500 | |
| Previous Owner | Bevil Connie L | $99,960 |
Source: Public Records
Tax History
| Year | Tax Paid | Tax Assessment Tax Assessment Total Assessment is a certain percentage of the fair market value that is determined by local assessors to be the total taxable value of land and additions on the property. | Land | Improvement |
|---|---|---|---|---|
| 2025 | $1,686 | $20,921 | -- | -- |
| 2024 | $1,540 | $19,925 | -- | -- |
| 2023 | $1,540 | $38,800 | $7,760 | $31,040 |
| 2022 | $1,468 | $29,120 | $5,820 | $23,300 |
| 2021 | $1,483 | $26,930 | $5,380 | $21,550 |
| 2020 | $1,419 | $24,760 | $4,950 | $19,810 |
| 2019 | $1,379 | $23,260 | $4,650 | $18,610 |
| 2018 | $1,327 | $21,270 | $4,250 | $17,020 |
| 2017 | $1,270 | $19,580 | $3,910 | $15,670 |
| 2016 | $1,247 | $19,180 | $3,830 | $15,350 |
| 2015 | $1,191 | $16,830 | $3,360 | $13,470 |
Source: Public Records
Map
Nearby Homes
- 2610 S Fairfield Dr
- 1939 E Alameda Dr
- 1986 E Palmcroft Dr
- 2618 S Shannon Dr
- 2065 E Cairo Dr
- 2132 E Broadmor Dr
- 1907 E Broadway Rd
- 1832 S River Dr
- 2923 S Bala Dr
- 2226 S Kachina Dr
- 2134 E Broadway Rd Unit 1039
- 2134 E Broadway Rd Unit 1035
- 2717 S Alder Dr
- 1706 E Gaylon Dr
- 1527 S River Dr
- 2912 S Price Rd
- 2151 E Sanos Dr
- 3147 S Fairfield Dr
- 2300 E Concorda Dr
- 2015 E Southern Ave Unit 14
- 1977 E Meadow Dr
- 1984 E Loma Vista Dr
- 2005 E Meadow Dr
- 1971 E Meadow Dr
- 1978 E Loma Vista Dr
- 2414 S Clark Dr
- 2006 E Loma Vista Dr Unit 1
- 1965 E Meadow Dr
- 2011 E Meadow Dr
- 1972 E Loma Vista Dr
- 2410 S Clark Dr
- 2606 S Country Club Way
- 1959 E Meadow Dr
- 2017 E Meadow Dr
- 1966 E Loma Vista Dr
- 2417 S Clark Dr Unit 1
- 2406 S Clark Dr
- 2014 E Loma Vista Dr
- 2609 S Country Club Way
- 2413 S Clark Dr
Your Personal Tour Guide
Ask me questions while you tour the home.