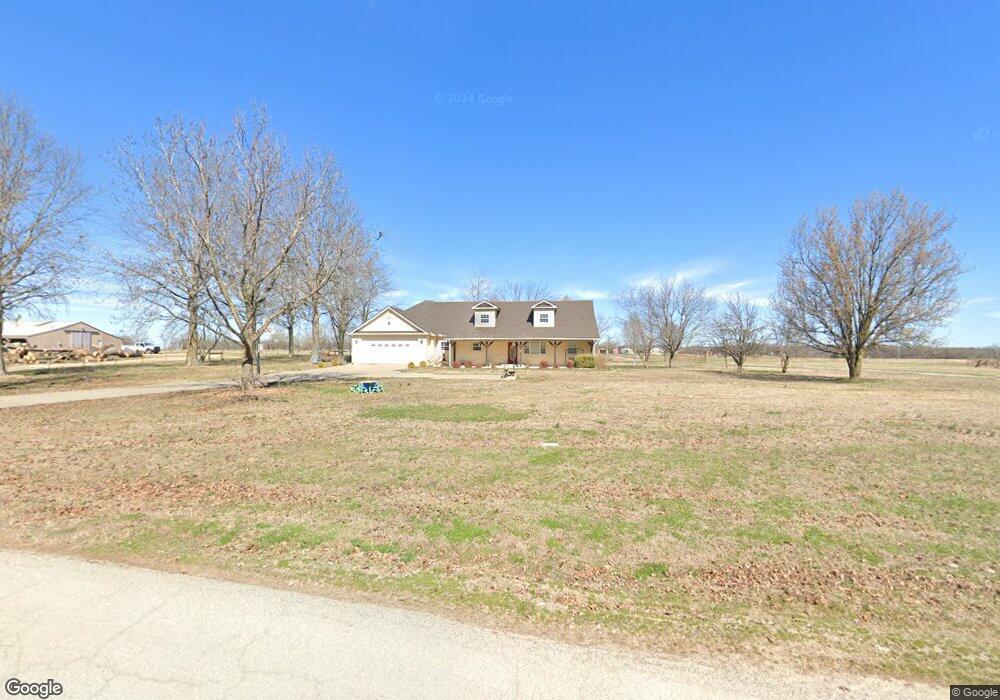
19836 Shinn Springs Rd Siloam Springs, AR 72761
Estimated Value: $302,000 - $397,000
--
Bed
2
Baths
1,897
Sq Ft
$180/Sq Ft
Est. Value
About This Home
This home is located at 19836 Shinn Springs Rd, Siloam Springs, AR 72761 and is currently estimated at $342,395, approximately $180 per square foot. 19836 Shinn Springs Rd is a home located in Benton County with nearby schools including Northside Elementary School, Southside Elementary School, and Delbert Pete & Pat Allen Elementary School.
Ownership History
Date
Name
Owned For
Owner Type
Purchase Details
Closed on
Nov 17, 2014
Sold by
Russell Clara and Russell Johnny
Bought by
Butler Steven Lynn and Butler Stephanie Ginger
Current Estimated Value
Purchase Details
Closed on
Nov 16, 2007
Sold by
Russell Johnny and Russell Clara
Bought by
Russell Johnny and Russell Clara
Purchase Details
Closed on
Aug 23, 2004
Bought by
Russell 26 and Russell 23Ac
Purchase Details
Closed on
Aug 22, 2004
Bought by
Russell 26 and Russell 23Ac
Purchase Details
Closed on
May 15, 2003
Bought by
Russell S
Purchase Details
Closed on
Feb 13, 2001
Bought by
Collette Collette 1 and Collette 73Ac
Purchase Details
Closed on
Feb 5, 2001
Bought by
Collette
Purchase Details
Closed on
May 19, 2000
Bought by
Russell J-Russell S Ac
Create a Home Valuation Report for This Property
The Home Valuation Report is an in-depth analysis detailing your home's value as well as a comparison with similar homes in the area
Home Values in the Area
Average Home Value in this Area
Purchase History
| Date | Buyer | Sale Price | Title Company |
|---|---|---|---|
| Butler Steven Lynn | $425,000 | None Available | |
| Russell Johnny | -- | None Available | |
| Russell 26 | -- | -- | |
| Russell 26 | -- | -- | |
| Russell S | -- | -- | |
| Collette Collette 1 | -- | -- | |
| Collette | $11,000 | -- | |
| Russell J-Russell S Ac | $74,000 | -- |
Source: Public Records
Tax History Compared to Growth
Tax History
| Year | Tax Paid | Tax Assessment Tax Assessment Total Assessment is a certain percentage of the fair market value that is determined by local assessors to be the total taxable value of land and additions on the property. | Land | Improvement |
|---|---|---|---|---|
| 2025 | $224 | $4,397 | $1,400 | $2,997 |
| 2024 | $224 | $4,397 | $1,400 | $2,997 |
| 2023 | $203 | $3,900 | $1,330 | $2,570 |
| 2022 | $203 | $3,900 | $1,330 | $2,570 |
| 2021 | $203 | $3,900 | $1,330 | $2,570 |
| 2020 | $199 | $3,820 | $1,250 | $2,570 |
| 2019 | $199 | $3,820 | $1,250 | $2,570 |
| 2018 | $199 | $3,820 | $1,250 | $2,570 |
| 2017 | $1,169 | $3,820 | $1,250 | $2,570 |
| 2016 | $1,169 | $3,820 | $1,250 | $2,570 |
| 2015 | $1,169 | $29,980 | $2,090 | $27,890 |
| 2014 | $819 | $29,980 | $2,090 | $27,890 |
Source: Public Records
Map
Nearby Homes
- 3605 N Marian St
- 15564 Airport Rd
- 8006 David Dr
- 509 Carter Rd
- 7004 David Dr
- 6008 David Dr
- 0 E Sugarloaf St
- 16013 N Airport Rd
- 0 Bill Young Rd Unit 21090656
- 0 Bill Young Rd Unit 1323460
- 19941 Edgewood Cir
- 19372 Old Highway 68 E
- 0 Old Highway 68 Unit 25340983
- 19100 Bill Young Rd
- 2.8 Acres Southern View
- 14987 S Highway 59
- 925 S Canvasback Dr
- 920 S Canvasback Dr
- 1729-4 Plan at
- 820 S Parrot Ln
- 19848 Shinn Springs Rd
- 19715 Shinn Springs Rd
- 19831 Shinn Springs Rd
- 19858 Shinn Springs Rd
- 19996 Shinn Springs Rd
- 19780 Shinn Springs Rd
- 19993 Shinn Springs Rd
- 19798 Shinn Springs Rd
- 15747 Russell Rd
- 19897 Shinn Springs Rd
- 19781 Shinn Springs Rd
- 19718 Shinn Springs Rd
- 0 Shinn Springs Rd
- 20161 Shinn Springs Rd
- 19638 Shinn Springs Rd
- 20058 Shinn Springs Rd
- 17560 Shinn Springs Rd
- 19642 Shinn Springs Rd
- 19652 Shinn Springs Rd
- 19648 Shinn Springs Rd