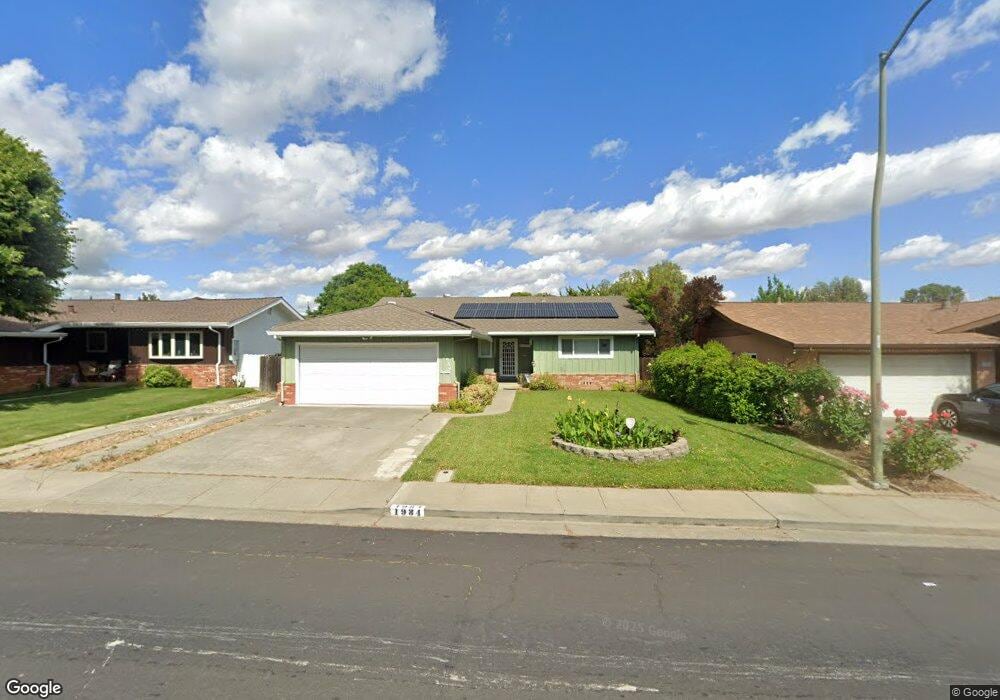
1984 Barbour Dr Fairfield, CA 94534
Estimated Value: $579,000 - $635,000
4
Beds
2
Baths
1,726
Sq Ft
$347/Sq Ft
Est. Value
About This Home
This home is located at 1984 Barbour Dr, Fairfield, CA 94534 and is currently estimated at $598,477, approximately $346 per square foot. 1984 Barbour Dr is a home located in Solano County with nearby schools including K. I. Jones Elementary School, Angelo Rodriguez High School, and Solano Christian Academy.
Ownership History
Date
Name
Owned For
Owner Type
Purchase Details
Closed on
Oct 22, 2024
Sold by
Townsend Michael and Townsend Rosalinde Mcgregor
Bought by
2024 Townsend Family Trust and Townsend
Current Estimated Value
Purchase Details
Closed on
Jul 30, 2020
Sold by
Townsend Gloria M and The Gloira M Townsend Revocabl
Bought by
Townsend Michael and Townsend Mcgregor
Purchase Details
Closed on
Aug 31, 2011
Sold by
Lacrosse Erin
Bought by
Townsend Gloria M
Purchase Details
Closed on
Oct 2, 2008
Sold by
Mcdavitt Theodore
Bought by
Lacrosse Erin
Home Financials for this Owner
Home Financials are based on the most recent Mortgage that was taken out on this home.
Original Mortgage
$314,225
Interest Rate
6.43%
Mortgage Type
FHA
Purchase Details
Closed on
Oct 23, 2007
Sold by
Butler William E
Bought by
Butler William E
Create a Home Valuation Report for This Property
The Home Valuation Report is an in-depth analysis detailing your home's value as well as a comparison with similar homes in the area
Home Values in the Area
Average Home Value in this Area
Purchase History
| Date | Buyer | Sale Price | Title Company |
|---|---|---|---|
| 2024 Townsend Family Trust | -- | None Listed On Document | |
| 2024 Townsend Family Trust | -- | None Listed On Document | |
| Townsend Michael | -- | None Available | |
| Townsend Gloria M | $199,000 | First American Title Company | |
| Lacrosse Erin | $320,000 | Placer Title Company | |
| Butler William E | -- | None Available |
Source: Public Records
Mortgage History
| Date | Status | Borrower | Loan Amount |
|---|---|---|---|
| Previous Owner | Lacrosse Erin | $314,225 |
Source: Public Records
Tax History Compared to Growth
Tax History
| Year | Tax Paid | Tax Assessment Tax Assessment Total Assessment is a certain percentage of the fair market value that is determined by local assessors to be the total taxable value of land and additions on the property. | Land | Improvement |
|---|---|---|---|---|
| 2025 | $2,807 | $249,943 | $62,796 | $187,147 |
| 2024 | $2,807 | $245,043 | $61,566 | $183,477 |
| 2023 | $2,721 | $240,239 | $60,359 | $179,880 |
| 2022 | $2,689 | $235,529 | $59,176 | $176,353 |
| 2021 | $2,662 | $230,912 | $58,016 | $172,896 |
| 2020 | $2,600 | $228,546 | $57,422 | $171,124 |
| 2019 | $2,536 | $224,066 | $56,297 | $167,769 |
| 2018 | $1,032 | $219,674 | $55,194 | $164,480 |
| 2017 | $1,000 | $215,367 | $54,112 | $161,255 |
| 2016 | $251 | $211,145 | $53,051 | $158,094 |
| 2015 | $223 | $207,975 | $52,255 | $155,720 |
| 2014 | $204 | $203,902 | $51,232 | $152,670 |
Source: Public Records
Map
Nearby Homes
- 1737 Alford Dr
- 2051 Barbour Dr
- 2045 Dorland Dr
- 2635 Alvarado Ct Unit 3
- 2724 Toland Dr
- 2796 Mankas Blvd
- 1331 Canterbury Dr
- 2846 Owens St
- 2695 Vista Linda
- 1300 Sunningdale Ln
- 1308 Sunningdale Ln
- 1301 Sunningdale Ln
- Cora Plan at Brighton Place
- Bryce Plan at Brighton Place
- 1305 Sunningdale Ln
- 1309 Sunningdale Ln
- 81 Del Prado Cir
- 2530 Vista Grande
- 2207 Cunningham Dr
- 2415 Tea Ct