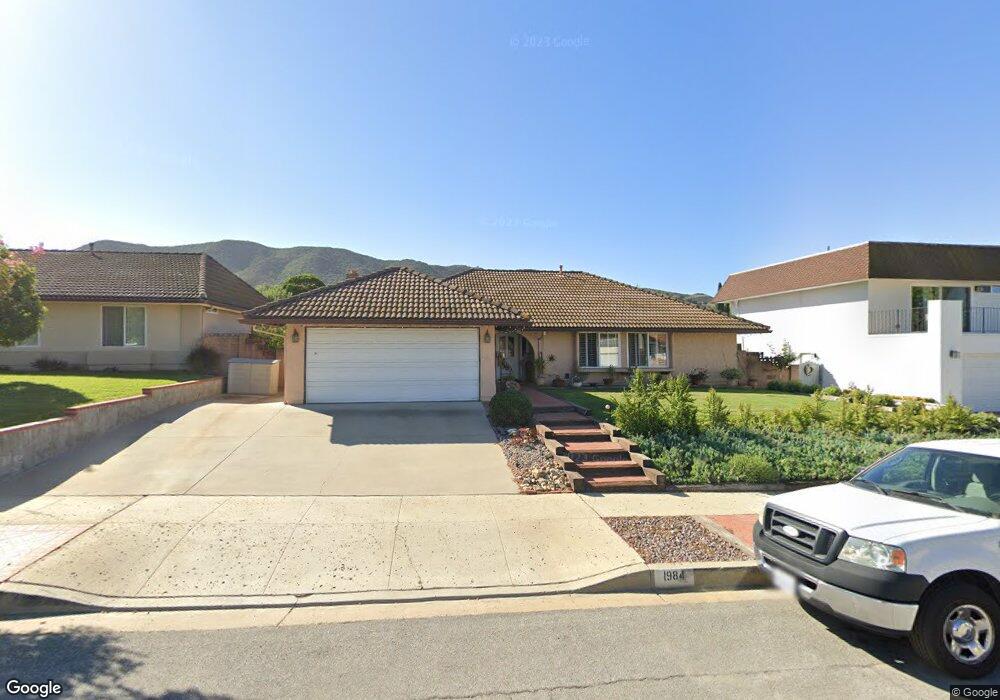
1984 Gila Ct Newbury Park, CA 91320
Estimated Value: $824,000 - $1,007,000
4
Beds
2
Baths
1,687
Sq Ft
$550/Sq Ft
Est. Value
About This Home
This home is located at 1984 Gila Ct, Newbury Park, CA 91320 and is currently estimated at $927,094, approximately $549 per square foot. 1984 Gila Ct is a home located in Ventura County with nearby schools including Banyan Elementary School, Sequoia Middle School, and Newbury Park High School.
Ownership History
Date
Name
Owned For
Owner Type
Purchase Details
Closed on
Nov 17, 2003
Sold by
Schlimgen Robert L and Schlimgen Ruth C
Bought by
Schlimgen Robert L and Schlimgen Ruth C
Current Estimated Value
Home Financials for this Owner
Home Financials are based on the most recent Mortgage that was taken out on this home.
Original Mortgage
$138,000
Interest Rate
5.98%
Mortgage Type
Purchase Money Mortgage
Purchase Details
Closed on
Oct 22, 2003
Sold by
Schlimgen Robert L and Schlimgen Ruth C
Bought by
Schlimgen Robert L and Schlimgen Ruth C
Home Financials for this Owner
Home Financials are based on the most recent Mortgage that was taken out on this home.
Original Mortgage
$138,000
Interest Rate
5.98%
Mortgage Type
Purchase Money Mortgage
Purchase Details
Closed on
Aug 22, 2000
Sold by
Robert Schlimgen
Bought by
Schlimgen Robert L and Schlimgen Ruth C
Create a Home Valuation Report for This Property
The Home Valuation Report is an in-depth analysis detailing your home's value as well as a comparison with similar homes in the area
Home Values in the Area
Average Home Value in this Area
Purchase History
| Date | Buyer | Sale Price | Title Company |
|---|---|---|---|
| Schlimgen Robert L | -- | -- | |
| Schlimgen Robert L | -- | First American Title Ins Co | |
| Schlimgen Robert L | -- | -- |
Source: Public Records
Mortgage History
| Date | Status | Borrower | Loan Amount |
|---|---|---|---|
| Closed | Schlimgen Robert L | $138,000 |
Source: Public Records
Tax History Compared to Growth
Tax History
| Year | Tax Paid | Tax Assessment Tax Assessment Total Assessment is a certain percentage of the fair market value that is determined by local assessors to be the total taxable value of land and additions on the property. | Land | Improvement |
|---|---|---|---|---|
| 2025 | $1,402 | $90,926 | $21,895 | $69,031 |
| 2024 | $1,402 | $89,144 | $21,466 | $67,678 |
| 2023 | $1,335 | $87,397 | $21,046 | $66,351 |
| 2022 | $1,306 | $85,684 | $20,634 | $65,050 |
| 2021 | $1,277 | $84,004 | $20,229 | $63,775 |
| 2020 | $905 | $83,145 | $20,023 | $63,122 |
| 2019 | $881 | $81,516 | $19,631 | $61,885 |
| 2018 | $862 | $79,919 | $19,247 | $60,672 |
| 2017 | $844 | $78,353 | $18,870 | $59,483 |
| 2016 | $835 | $76,817 | $18,500 | $58,317 |
| 2015 | $820 | $75,665 | $18,223 | $57,442 |
| 2014 | $807 | $74,185 | $17,867 | $56,318 |
Source: Public Records
Map
Nearby Homes
- 1930 Adrian St
- 5 S Beatty Place
- 251 Asta Ct
- 190 Donegal Ave
- 2742 Borchard Rd Unit 207
- 16 Robertson Way
- 1667 Calle Zafiro Unit 4
- 184 Pepper Rd
- 628 Paseo la Perla
- 122 Beech Rd
- 1 Ortega Dr
- 1325 Ashton Park Ln
- 602 Avenida Del Platino
- 155 Maple Rd
- 2775 Edgeview Ct
- 1315 Ramona Dr
- 639 Avenida Del Platino
- 1689 Amador Ln
- 1258 Ramona Dr
- 0 Rudolph Drive Lots 45 46 Dr