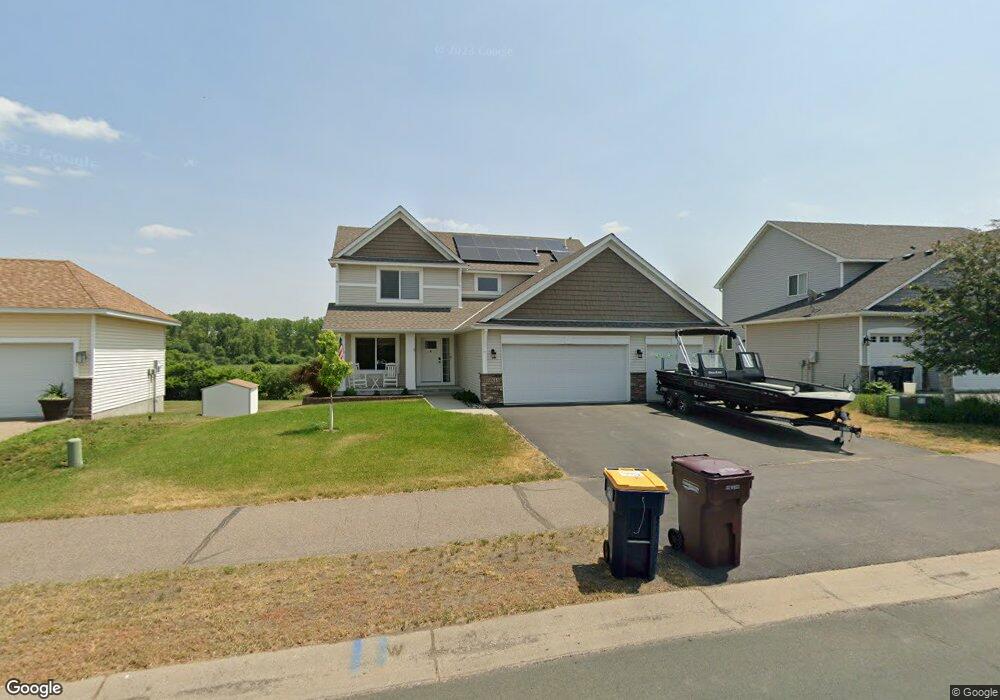
19848 Deerbrooke Path Farmington, MN 55024
Estimated Value: $523,237 - $542,000
4
Beds
3
Baths
2,185
Sq Ft
$243/Sq Ft
Est. Value
About This Home
This home is located at 19848 Deerbrooke Path, Farmington, MN 55024 and is currently estimated at $530,309, approximately $242 per square foot. 19848 Deerbrooke Path is a home located in Dakota County with nearby schools including Riverview Elementary School, Robert Boeckman Middle School, and Farmington High School.
Ownership History
Date
Name
Owned For
Owner Type
Purchase Details
Closed on
Aug 8, 2022
Sold by
Sayler Brent and Sayler Heather
Bought by
Llerena Jessica
Current Estimated Value
Home Financials for this Owner
Home Financials are based on the most recent Mortgage that was taken out on this home.
Original Mortgage
$351,363
Outstanding Balance
$336,705
Interest Rate
5.81%
Mortgage Type
New Conventional
Estimated Equity
$193,604
Purchase Details
Closed on
Jul 30, 2015
Sold by
Key Land Homes
Bought by
Sayler Brent and Sayler Heather
Home Financials for this Owner
Home Financials are based on the most recent Mortgage that was taken out on this home.
Original Mortgage
$350,655
Interest Rate
4.01%
Mortgage Type
VA
Purchase Details
Closed on
Sep 24, 2013
Home Financials for this Owner
Home Financials are based on the most recent Mortgage that was taken out on this home.
Original Mortgage
$127,800
Interest Rate
4.5%
Create a Home Valuation Report for This Property
The Home Valuation Report is an in-depth analysis detailing your home's value as well as a comparison with similar homes in the area
Home Values in the Area
Average Home Value in this Area
Purchase History
| Date | Buyer | Sale Price | Title Company |
|---|---|---|---|
| Llerena Jessica | $535,000 | -- | |
| Sayler Brent | $350,654 | Global Closing | |
| -- | $127,800 | -- |
Source: Public Records
Mortgage History
| Date | Status | Borrower | Loan Amount |
|---|---|---|---|
| Open | Llerena Jessica | $351,363 | |
| Previous Owner | Sayler Brent | $350,655 | |
| Previous Owner | -- | $127,800 |
Source: Public Records
Tax History Compared to Growth
Tax History
| Year | Tax Paid | Tax Assessment Tax Assessment Total Assessment is a certain percentage of the fair market value that is determined by local assessors to be the total taxable value of land and additions on the property. | Land | Improvement |
|---|---|---|---|---|
| 2024 | $5,446 | $447,800 | $115,000 | $332,800 |
| 2023 | $5,446 | $447,200 | $115,200 | $332,000 |
| 2022 | $5,144 | $422,300 | $114,900 | $307,400 |
| 2021 | $5,110 | $364,300 | $112,500 | $251,800 |
| 2020 | $5,008 | $359,400 | $107,100 | $252,300 |
| 2019 | $5,103 | $339,800 | $102,000 | $237,800 |
| 2018 | $4,973 | $339,200 | $97,100 | $242,100 |
| 2017 | $4,994 | $321,600 | $92,500 | $229,100 |
| 2016 | $724 | $314,000 | $87,700 | $226,300 |
| 2015 | $1,222 | $40,020 | $40,020 | $0 |
| 2014 | -- | $62,100 | $62,100 | $0 |
| 2013 | -- | $55,900 | $55,900 | $0 |
Source: Public Records
Map
Nearby Homes
- 19697 Deerbrooke Path
- 4578 198th St W
- 4569 196th St W
- 19363 Colonial Trail
- 19335 Colonial Trail
- 19318 Colonial Trail
- Carter Plan at North Creek - Smart Series
- Cedarwood Plan at North Creek - Hans Hagen Villa Collection
- Cedarwood II Plan at North Creek - Hans Hagen Villa Collection
- Elmwood IV Plan at North Creek - Hans Hagen Villa Collection
- Aspen Plan at North Creek - Hans Hagen Villa Collection
- Hillcrest Plan at North Creek - Hans Hagen Villa Collection
- Carlton Plan at North Creek - Smart Series
- Canton Plan at North Creek - Smart Series
- Willow II Plan at North Creek - Hans Hagen Villa Collection
- Carly Plan at North Creek - Smart Series
- Sophia Plan at North Creek - Smart Series
- Dearborn Plan at North Creek - Smart Series
- Magnolia Plan at North Creek - Hans Hagen Villa Collection
- Devin Plan at North Creek - Smart Series
- 19850 Deerbrooke Path
- 19846 Deerbrooke Path
- 19801 Denali Way
- 19884 Dawson Ln
- 19880 Dawson Ln
- 19845 Deerbrooke Path
- 19876 Dawson Ln
- 19872 Dawson Ln
- 19841 Deerbrooke Path
- 19853 Deerbrooke Path
- 19837 Deerbrooke Path
- 19809 Denali Way
- 19858 Deerbrooke Path
- 19867 Dawson Ln
- 19857 Deerbrooke Path
- 19806 Denali Way
- 19833 Deerbrooke Path
- 19863 Dawson Ln
- 19813 Denali Way
- 19862 Deerbrooke Path