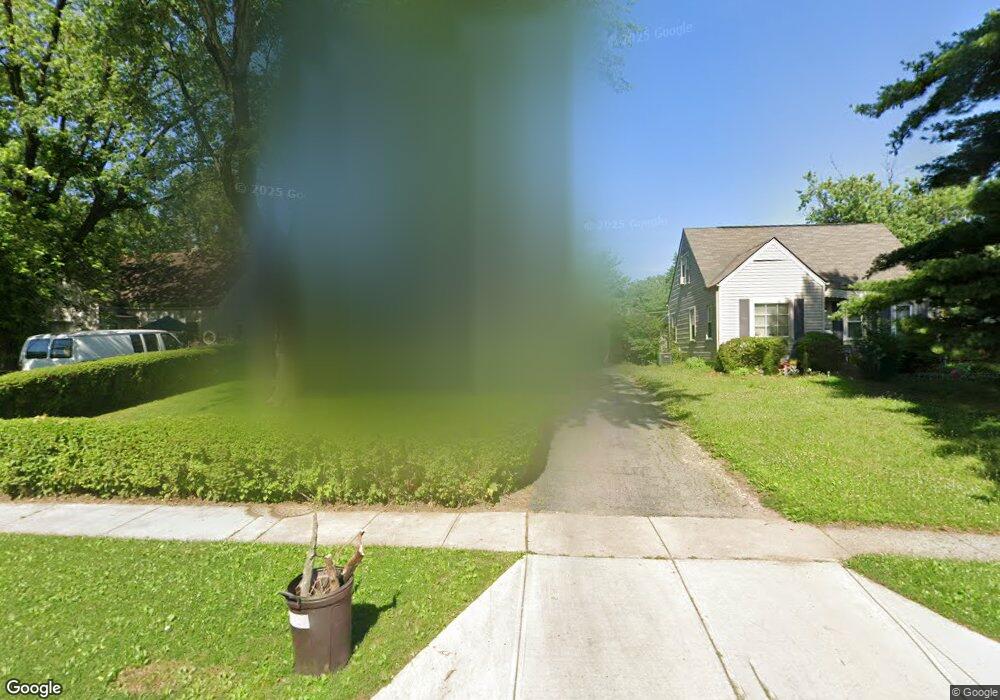
1985 Brentnell Ave Columbus, OH 43219
Woodland Holt NeighborhoodEstimated Value: $146,542 - $216,000
3
Beds
1
Bath
1,071
Sq Ft
$165/Sq Ft
Est. Value
About This Home
This home is located at 1985 Brentnell Ave, Columbus, OH 43219 and is currently estimated at $176,386, approximately $164 per square foot. 1985 Brentnell Ave is a home located in Franklin County with nearby schools including South Mifflin Stem Academy (K-6), Linden-Mckinley Stem School On Arcadia, and Cesar Chavez College Preparatory School.
Ownership History
Date
Name
Owned For
Owner Type
Purchase Details
Closed on
May 31, 2005
Sold by
Robertson Lenair and Robertson Azalia D
Bought by
Davis Marvin and Davis Marvin R
Current Estimated Value
Home Financials for this Owner
Home Financials are based on the most recent Mortgage that was taken out on this home.
Original Mortgage
$65,520
Outstanding Balance
$38,458
Interest Rate
7.75%
Mortgage Type
Purchase Money Mortgage
Estimated Equity
$137,928
Purchase Details
Closed on
Jul 1, 2001
Sold by
Spires Carlos S and Estate Of Catherine M Spires
Bought by
Robertson Lenair and Robertson Azalia D
Home Financials for this Owner
Home Financials are based on the most recent Mortgage that was taken out on this home.
Original Mortgage
$32,000
Interest Rate
7.22%
Purchase Details
Closed on
Apr 3, 1992
Bought by
Spires Catherine M
Create a Home Valuation Report for This Property
The Home Valuation Report is an in-depth analysis detailing your home's value as well as a comparison with similar homes in the area
Home Values in the Area
Average Home Value in this Area
Purchase History
| Date | Buyer | Sale Price | Title Company |
|---|---|---|---|
| Davis Marvin | $81,900 | Trident Title Agency | |
| Robertson Lenair | $40,000 | Service Title Agency | |
| Spires Catherine M | -- | -- |
Source: Public Records
Mortgage History
| Date | Status | Borrower | Loan Amount |
|---|---|---|---|
| Open | Davis Marvin | $65,520 | |
| Previous Owner | Robertson Lenair | $32,000 | |
| Closed | Davis Marvin | $16,380 |
Source: Public Records
Tax History Compared to Growth
Tax History
| Year | Tax Paid | Tax Assessment Tax Assessment Total Assessment is a certain percentage of the fair market value that is determined by local assessors to be the total taxable value of land and additions on the property. | Land | Improvement |
|---|---|---|---|---|
| 2024 | $1,474 | $32,840 | $8,370 | $24,470 |
| 2023 | $1,455 | $32,830 | $8,365 | $24,465 |
| 2022 | $854 | $16,460 | $2,420 | $14,040 |
| 2021 | $855 | $16,460 | $2,420 | $14,040 |
| 2020 | $856 | $16,460 | $2,420 | $14,040 |
| 2019 | $775 | $12,780 | $1,960 | $10,820 |
| 2018 | $845 | $12,780 | $1,960 | $10,820 |
| 2017 | $775 | $12,780 | $1,960 | $10,820 |
| 2016 | $1,009 | $15,230 | $2,730 | $12,500 |
| 2015 | $916 | $15,230 | $2,730 | $12,500 |
| 2014 | $918 | $15,230 | $2,730 | $12,500 |
| 2013 | $504 | $16,940 | $3,045 | $13,895 |
Source: Public Records
Map
Nearby Homes
- 2336 Edenburgh Dr S
- 1882 Dunning Rd
- 0 Mock Rd
- 2054 Jermain Dr
- 1808 Brentnell Ave
- 2471 Mock Rd
- 2398 Dunkirk Dr
- 1794 Devonshire Rd
- 0 Danby Dr
- 1790 Marston Rd
- 1789 Marston Rd
- 1991 Woodland Ave
- 0 Rankin Ave Unit (Rear)
- 1975 Mock Rd
- 1978 Argyle Dr
- 2040 Loretta Ave
- 0 Parkwood Ave
- 2228 Holt Ave
- 2386 Century Dr
- 2736 Bellero Way Unit 94
- 1991 Brentnell Ave
- 1977 Brentnell Ave
- 1997 Brentnell Ave
- 1971 Brentnell Ave
- 1992 Marston Rd
- 1965 Brentnell Ave
- 2005 Brentnell Ave
- 1986 Marston Rd
- 1998 Marston Rd
- 2004 Marston Rd
- 1980 Marston Rd
- 2011 Brentnell Ave
- 1959 Brentnell Ave
- 2012 Marston Rd
- 1974 Marston Rd
- 1984 Brentnell Ave
- 1976 Brentnell Ave
- 1990 Brentnell Ave
- 2018 Marston Rd
- 1996 Brentnell Ave