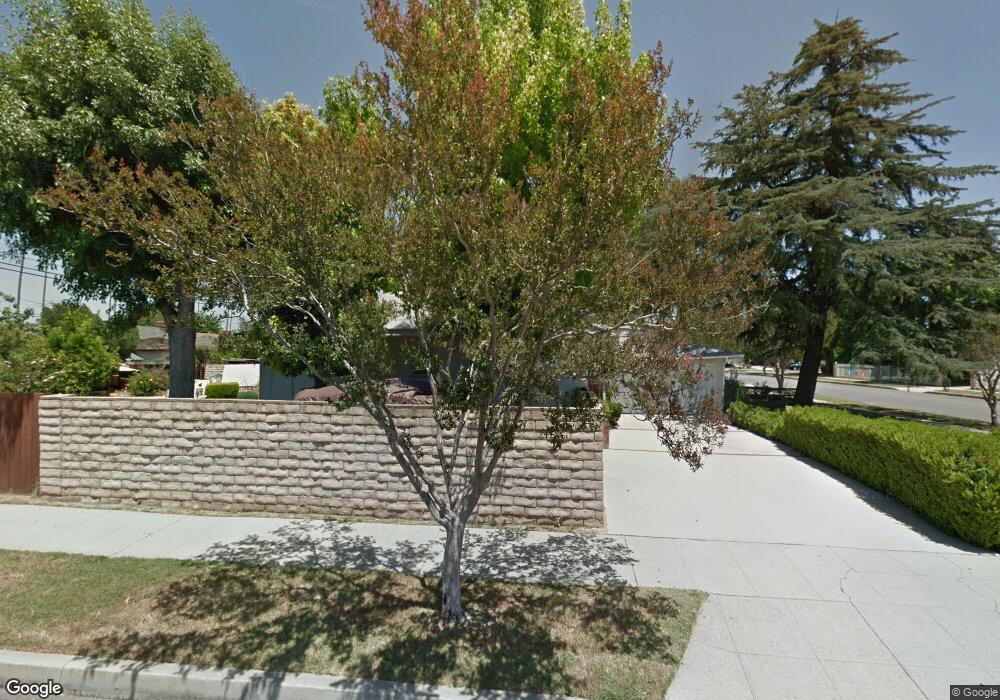
19857 Enadia Way Winnetka, CA 91306
Estimated Value: $757,000 - $820,000
3
Beds
2
Baths
1,251
Sq Ft
$624/Sq Ft
Est. Value
About This Home
This home is located at 19857 Enadia Way, Winnetka, CA 91306 and is currently estimated at $781,241, approximately $624 per square foot. 19857 Enadia Way is a home located in Los Angeles County with nearby schools including Shirley Avenue Elementary School, John A. Sutter Middle School, and Citizens of the World West Valley.
Ownership History
Date
Name
Owned For
Owner Type
Purchase Details
Closed on
Sep 6, 2024
Sold by
Furbush Family Living Trust and Furbush Jeffery Lawrence
Bought by
Furbush Family Living Trust and Furbush
Current Estimated Value
Home Financials for this Owner
Home Financials are based on the most recent Mortgage that was taken out on this home.
Original Mortgage
$300,000
Outstanding Balance
$296,791
Interest Rate
6.73%
Mortgage Type
New Conventional
Estimated Equity
$484,450
Purchase Details
Closed on
Feb 26, 2020
Sold by
Furbush Nora Hilda and Eckstein Nora Hilda
Bought by
Furbush Jeffery Lawrence and Furbush Nora Hilda
Purchase Details
Closed on
Jan 12, 2018
Sold by
Eckstein Nora Hilda and The Eckstein Trust
Bought by
Eckstein Nora Hilda
Purchase Details
Closed on
Jun 8, 2006
Sold by
Eckstein Hildegard H
Bought by
The Eckstein Trust
Create a Home Valuation Report for This Property
The Home Valuation Report is an in-depth analysis detailing your home's value as well as a comparison with similar homes in the area
Home Values in the Area
Average Home Value in this Area
Purchase History
| Date | Buyer | Sale Price | Title Company |
|---|---|---|---|
| Furbush Family Living Trust | -- | Lawyers Title Company | |
| Furbush Jeffery Lawrence | -- | None Available | |
| Eckstein Nora Hilda | -- | None Available | |
| The Eckstein Trust | -- | None Available |
Source: Public Records
Mortgage History
| Date | Status | Borrower | Loan Amount |
|---|---|---|---|
| Open | Furbush Family Living Trust | $300,000 |
Source: Public Records
Tax History
| Year | Tax Paid | Tax Assessment Tax Assessment Total Assessment is a certain percentage of the fair market value that is determined by local assessors to be the total taxable value of land and additions on the property. | Land | Improvement |
|---|---|---|---|---|
| 2025 | $1,824 | $125,845 | $73,431 | $52,414 |
| 2024 | $1,824 | $123,379 | $71,992 | $51,387 |
| 2023 | $1,795 | $120,961 | $70,581 | $50,380 |
| 2022 | $1,721 | $118,591 | $69,198 | $49,393 |
| 2021 | $1,695 | $116,267 | $67,842 | $48,425 |
| 2020 | $1,707 | $115,076 | $67,147 | $47,929 |
| 2019 | $1,651 | $112,821 | $65,831 | $46,990 |
| 2018 | $1,507 | $110,610 | $64,541 | $46,069 |
| 2016 | $1,429 | $106,317 | $62,036 | $44,281 |
| 2015 | $1,410 | $104,721 | $61,105 | $43,616 |
| 2014 | $1,426 | $102,671 | $59,909 | $42,762 |
Source: Public Records
Map
Nearby Homes
- 19950 Sherman Way Unit A
- 19832 Schoolcraft St
- 7306 Jumilla Ave
- 7308 Corbin Ave Unit G
- 6902 Quakertown Ave
- 7414 Quartz Ave
- 20134 Leadwell St Unit 218
- 20134 Leadwell St
- 20134 Leadwell St Unit 374
- 20134 Leadwell St Unit 332
- 20134 Leadwell St Unit 159
- 6900 Corbin Ave
- 19612 Schoolcraft St
- 19545 Sherman Way Unit 74
- 20224 Sherman Way Unit 14
- 19512 Leadwell St
- 6800 Corbin Ave Unit 308
- 19832 Welby Way
- 19858 Saticoy St
- 20243 Valerio St
- 19851 Enadia Way
- 19843 Enadia Way
- 19901 Enadia Way
- 19858 Sherman Way
- 19852 Sherman Way
- 19854 Enadia Way
- 19846 Sherman Way
- 19837 Enadia Way
- 19900 Sherman Way
- 19907 Enadia Way
- 19844 Enadia Way
- 19902 Enadia Way
- 19840 Sherman Way
- 19906 Sherman Way
- 19831 Enadia Way
- 7112 Oakdale Ave
- 19834 Enadia Way
- 19915 Enadia Way
- 19836 Sherman Way
- 19912 Sherman Way
Your Personal Tour Guide
Ask me questions while you tour the home.