Estimated Value: $180,000 - $185,000
3
Beds
1
Bath
1,097
Sq Ft
$167/Sq Ft
Est. Value
About This Home
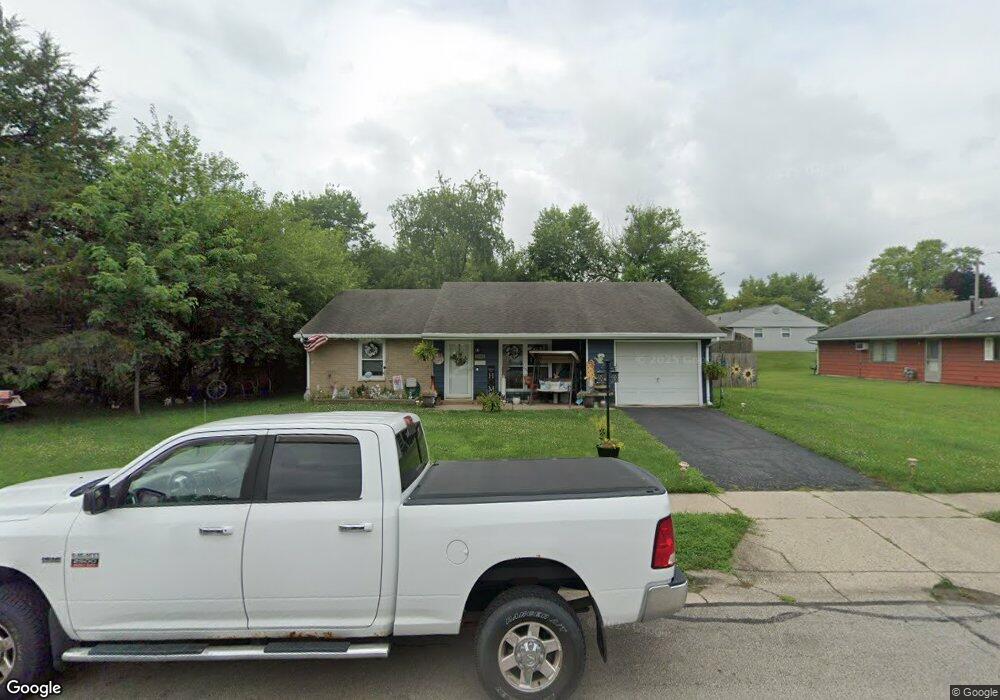
This home is located at 1986 Atkinson Dr, Xenia, OH 45385 and is currently estimated at $182,802, approximately $166 per square foot. 1986 Atkinson Dr is a home located in Greene County with nearby schools including Xenia High School, Summit Academy Community School for Alternative Learners - Xenia, and Legacy Christian Academy.
Ownership History
Date
Name
Owned For
Owner Type
Purchase Details
Closed on
Jun 16, 2021
Sold by
Johnson Donald A and Jacoby Tracy L
Bought by
Johnson Donald A and Jacoby Tracy L
Current Estimated Value
Purchase Details
Closed on
Sep 12, 2015
Sold by
Us Bank Trust Na
Bought by
Jacoby Tracy L and Jognson Donald A
Purchase Details
Closed on
Dec 10, 2004
Sold by
Williams Ted and Williams Carol
Bought by
Tabor Michael S and Tabor Heather D
Home Financials for this Owner
Home Financials are based on the most recent Mortgage that was taken out on this home.
Original Mortgage
$71,600
Interest Rate
7.7%
Mortgage Type
Unknown
Purchase Details
Closed on
May 25, 2002
Sold by
Williams Ted and Williams Carol
Bought by
Williams Ted and Williams Carol
Home Financials for this Owner
Home Financials are based on the most recent Mortgage that was taken out on this home.
Original Mortgage
$60,000
Interest Rate
6.75%
Create a Home Valuation Report for This Property
The Home Valuation Report is an in-depth analysis detailing your home's value as well as a comparison with similar homes in the area
Home Values in the Area
Average Home Value in this Area
Purchase History
| Date | Buyer | Sale Price | Title Company |
|---|---|---|---|
| Johnson Donald A | -- | None Available | |
| Jacoby Tracy L | $48,500 | Omega Title Agency Llc | |
| Tabor Michael S | $89,500 | -- | |
| Williams Ted | -- | -- |
Source: Public Records
Mortgage History
| Date | Status | Borrower | Loan Amount |
|---|---|---|---|
| Previous Owner | Tabor Michael S | $71,600 | |
| Previous Owner | Williams Ted | $60,000 | |
| Closed | Tabor Michael S | $17,900 |
Source: Public Records
Tax History Compared to Growth
Tax History
| Year | Tax Paid | Tax Assessment Tax Assessment Total Assessment is a certain percentage of the fair market value that is determined by local assessors to be the total taxable value of land and additions on the property. | Land | Improvement |
|---|---|---|---|---|
| 2024 | $1,920 | $46,040 | $13,070 | $32,970 |
| 2023 | $1,920 | $46,040 | $13,070 | $32,970 |
| 2022 | $1,581 | $32,330 | $7,690 | $24,640 |
| 2021 | $1,644 | $32,330 | $7,690 | $24,640 |
| 2020 | $1,575 | $32,330 | $7,690 | $24,640 |
| 2019 | $1,277 | $24,670 | $7,620 | $17,050 |
| 2018 | $1,282 | $24,670 | $7,620 | $17,050 |
| 2017 | $1,167 | $24,670 | $7,620 | $17,050 |
| 2016 | $1,168 | $22,060 | $7,620 | $14,440 |
| 2015 | $1,311 | $22,060 | $7,620 | $14,440 |
| 2014 | $1,091 | $22,060 | $7,620 | $14,440 |
Source: Public Records
Map
Nearby Homes
- 1255 Colorado Dr
- 1908 Whitt St
- 1107 Arkansas Dr
- 1866 Roxbury Dr
- 1829 Gayhart Dr
- 2499 Jenny Marie Dr
- 1769 Gayhart Dr
- 1403 Texas Dr
- 2345 Tennessee Dr
- 2540 Jenny Marie Dr
- 2421 Louisiana Dr
- 2257 Maryland Dr
- 2540 Cornwall Dr
- 0 Berkshire Dr Unit 942854
- 1778 Arapaho Dr
- 2142 Michigan Dr
- 1653 Seneca Dr
- 2545 Harmony Dr
- 1618 Navajo Dr
- 2692 Kingman Dr
- 2078 Gayhart Dr
- 2064 Gayhart Dr
- 1209 Colorado Dr
- 1981 Atkinson Dr
- 2050 Gayhart Dr
- 1193 Colorado Dr
- 1975 Atkinson Dr
- 1971 Atkinson Dr
- 1962 Atkinson Dr
- 1171 Colorado Dr
- 2149 Cornwall Dr
- 2063 Gayhart Dr
- 2038 Gayhart Dr
- 1244 Colorado Dr
- 2045 Gayhart Dr
- 2144 Cornwall Dr
- 1959 Atkinson Dr
- 2060 Westbury Ct
- 2096 Westbury Ct
- 1167 Colorado Dr