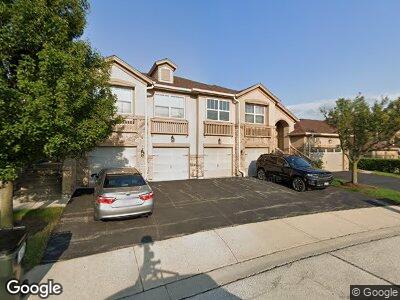
1986 Crenshaw Cir Unit 23 Vernon Hills, IL 60061
Gregg's Landing NeighborhoodEstimated Value: $406,000 - $446,000
2
Beds
2
Baths
1,860
Sq Ft
$228/Sq Ft
Est. Value
About This Home
This home is located at 1986 Crenshaw Cir Unit 23, Vernon Hills, IL 60061 and is currently estimated at $424,354, approximately $228 per square foot. 1986 Crenshaw Cir Unit 23 is a home located in Lake County with nearby schools including Hawthorn School Of Dual Language, Hawthorn Elementary School South, and Hawthorn Middle School North.
Ownership History
Date
Name
Owned For
Owner Type
Purchase Details
Closed on
Oct 18, 2024
Sold by
Paulson Family Revocable Trust and Paulson Thomas J
Bought by
Mescher Nancy M
Current Estimated Value
Purchase Details
Closed on
Sep 24, 2012
Sold by
Paulson Thomas E and Paulson Mary Jo
Bought by
Paulson Thomas and Paulson Family Revocable Trust
Purchase Details
Closed on
Jun 2, 2011
Sold by
Wasielewski Michelle Grunfeld and Grunfeld Rachel A
Bought by
Paulson Thomas E and Paulson Mary Jo
Purchase Details
Closed on
Jul 29, 2005
Sold by
Kb Home Illinois Inc
Bought by
Grunfeld Michelle and Grunfeld Rachel A
Home Financials for this Owner
Home Financials are based on the most recent Mortgage that was taken out on this home.
Original Mortgage
$178,000
Interest Rate
4%
Mortgage Type
Unknown
Create a Home Valuation Report for This Property
The Home Valuation Report is an in-depth analysis detailing your home's value as well as a comparison with similar homes in the area
Home Values in the Area
Average Home Value in this Area
Purchase History
| Date | Buyer | Sale Price | Title Company |
|---|---|---|---|
| Mescher Nancy M | $335,000 | Fidelity National Title | |
| Mescher Nancy M | $335,000 | Fidelity National Title | |
| Paulson Thomas | -- | None Available | |
| Paulson Thomas E | $257,500 | None Available | |
| Grunfeld Michelle | $362,500 | Ct |
Source: Public Records
Mortgage History
| Date | Status | Borrower | Loan Amount |
|---|---|---|---|
| Previous Owner | Grunfeld Michelle | $178,000 |
Source: Public Records
Tax History Compared to Growth
Tax History
| Year | Tax Paid | Tax Assessment Tax Assessment Total Assessment is a certain percentage of the fair market value that is determined by local assessors to be the total taxable value of land and additions on the property. | Land | Improvement |
|---|---|---|---|---|
| 2024 | $7,540 | $104,840 | $38,038 | $66,802 |
| 2023 | $7,647 | $96,698 | $35,084 | $61,614 |
| 2022 | $7,647 | $92,919 | $33,721 | $59,198 |
| 2021 | $7,304 | $90,919 | $32,995 | $57,924 |
| 2020 | $7,029 | $89,390 | $32,440 | $56,950 |
| 2019 | $6,853 | $88,540 | $32,132 | $56,408 |
| 2018 | $7,283 | $95,068 | $37,751 | $57,317 |
| 2017 | $7,215 | $92,066 | $36,559 | $55,507 |
| 2016 | $6,837 | $87,291 | $34,663 | $52,628 |
| 2015 | $6,692 | $81,588 | $32,398 | $49,190 |
| 2014 | $5,711 | $73,220 | $31,050 | $42,170 |
| 2012 | $6,186 | $70,340 | $29,829 | $40,511 |
Source: Public Records
Map
Nearby Homes
- 1952 Crenshaw Cir Unit 193
- 1209 Garfield Ave
- 311 Greentree Pkwy
- 237 Colonial Dr
- 1721 N Wood's Way
- 1875 Lake Charles Dr
- 1919 Lake Charles Dr
- 1933 Lake Charles Dr
- 1620 Nicklaus Ct
- 1939 Lake Charles Dr
- 1181 Furlong Dr
- 602 Paddock Ln
- 810 Braeman Ct Unit 2B
- 1322 Downs Pkwy Unit 53D
- 648 Marshall St
- 1323 Downs Pkwy Unit 50A
- 605 E Golf Rd
- 1132 Dawes St
- 1034 Crabtree Ln
- 1100 Juniper Pkwy
- 1986 Crenshaw Cir Unit 23
- 1984 Crenshaw Cir Unit 233
- 1982 Crenshaw Cir Unit 232
- 1980 Crenshaw Cir Unit 231
- 1977 Crenshaw Cir Unit 301
- 1975 Crenshaw Cir Unit 302
- 1973 Crenshaw Cir Unit 303
- 1971 Crenshaw Cir Unit 304
- 1932 Byman Ln Unit 29
- 1934 Byman Ln Unit 29
- 1925 Byman Ln Unit 271
- 1953 Crenshaw Cir Unit 312
- 1909 Crenshaw Cir Unit 81
- 1930 Byman Ln Unit 292
- 1928 Byman Ln Unit 29
- 1951 Crenshaw Cir Unit 313
- 1907 Crenshaw Cir Unit 82
- 1923 Byman Ln Unit 27
- 1905 Crenshaw Cir Unit 83
- 1903 Crenshaw Cir Unit 84