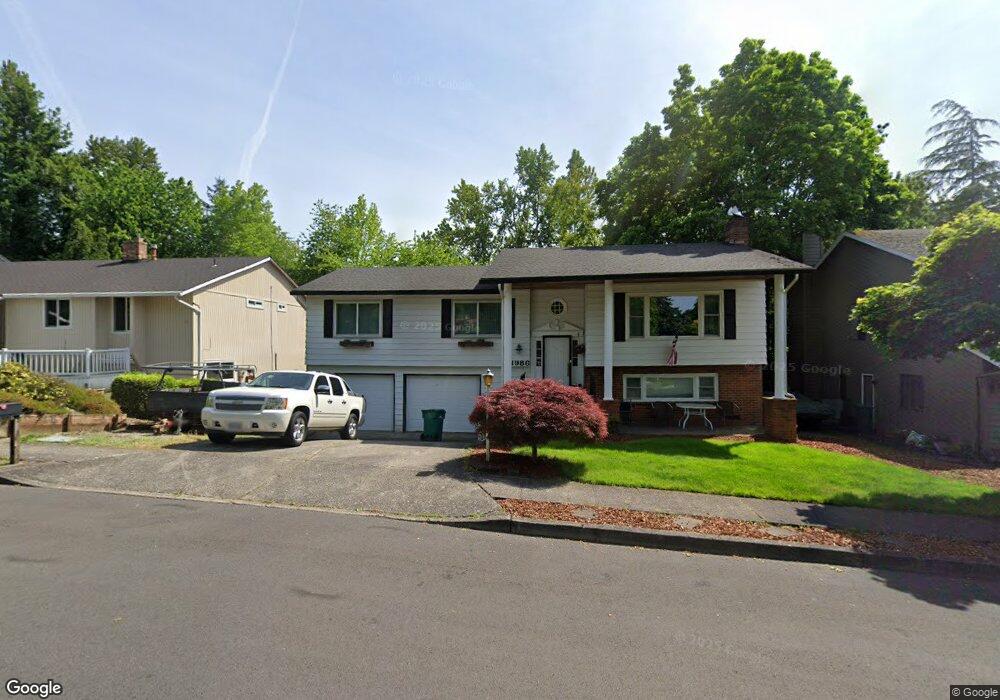
1986 SW 29th Dr Gresham, OR 97080
Southwest Gresham NeighborhoodEstimated Value: $517,000 - $563,000
3
Beds
3
Baths
2,382
Sq Ft
$228/Sq Ft
Est. Value
About This Home
This home is located at 1986 SW 29th Dr, Gresham, OR 97080 and is currently estimated at $543,589, approximately $228 per square foot. 1986 SW 29th Dr is a home located in Multnomah County with nearby schools including Dexter McCarty Middle School, Gresham High School, and Portland Adventist Elementary School.
Ownership History
Date
Name
Owned For
Owner Type
Purchase Details
Closed on
Apr 30, 2003
Sold by
Speiser Steve B
Bought by
Letele Samuel A and Letele Dawn Y
Current Estimated Value
Home Financials for this Owner
Home Financials are based on the most recent Mortgage that was taken out on this home.
Original Mortgage
$159,850
Outstanding Balance
$67,916
Interest Rate
5.72%
Mortgage Type
Purchase Money Mortgage
Estimated Equity
$475,673
Purchase Details
Closed on
Feb 20, 2001
Sold by
Vandyken Daniel J
Bought by
Speiser Steve B and Speiser Leslye
Home Financials for this Owner
Home Financials are based on the most recent Mortgage that was taken out on this home.
Original Mortgage
$158,746
Interest Rate
6.98%
Mortgage Type
FHA
Purchase Details
Closed on
Jan 8, 1996
Sold by
Powers William D
Bought by
Vandyken Daniel J and Vandyken Denys L
Home Financials for this Owner
Home Financials are based on the most recent Mortgage that was taken out on this home.
Original Mortgage
$124,000
Interest Rate
7.38%
Mortgage Type
Purchase Money Mortgage
Create a Home Valuation Report for This Property
The Home Valuation Report is an in-depth analysis detailing your home's value as well as a comparison with similar homes in the area
Home Values in the Area
Average Home Value in this Area
Purchase History
| Date | Buyer | Sale Price | Title Company |
|---|---|---|---|
| Letele Samuel A | $188,100 | First American | |
| Speiser Steve B | $184,364 | Chicago Title Insurance Co | |
| Vandyken Daniel J | $155,000 | Chicago Title |
Source: Public Records
Mortgage History
| Date | Status | Borrower | Loan Amount |
|---|---|---|---|
| Open | Letele Samuel A | $159,850 | |
| Previous Owner | Speiser Steve B | $158,746 | |
| Previous Owner | Vandyken Daniel J | $124,000 |
Source: Public Records
Tax History
| Year | Tax Paid | Tax Assessment Tax Assessment Total Assessment is a certain percentage of the fair market value that is determined by local assessors to be the total taxable value of land and additions on the property. | Land | Improvement |
|---|---|---|---|---|
| 2025 | $6,872 | $337,690 | -- | -- |
| 2024 | $6,578 | $327,860 | -- | -- |
| 2023 | $5,993 | $318,320 | $0 | $0 |
| 2022 | $5,826 | $309,050 | $0 | $0 |
| 2021 | $5,679 | $300,050 | $0 | $0 |
| 2020 | $5,343 | $291,320 | $0 | $0 |
| 2019 | $5,204 | $282,840 | $0 | $0 |
| 2018 | $4,962 | $274,610 | $0 | $0 |
| 2017 | $4,760 | $266,620 | $0 | $0 |
| 2016 | $4,197 | $258,860 | $0 | $0 |
| 2015 | $4,107 | $251,330 | $0 | $0 |
| 2014 | $3,966 | $244,010 | $0 | $0 |
Source: Public Records
Map
Nearby Homes
- 2160 SW 26th St
- 3120 SW Orchard Place
- 1645 SW 27th St
- 1320 SW 31st St
- 2520 SW Towle Ave
- 1278 SW 27th Ct
- 3506 SW Battaglia Ave
- 3512 SW Battaglia Ave
- 3536 SW Battaglia Ave
- 3558 SW Battaglia Ave
- 3503 SW Battaglia Ave
- 3582 SW Battaglia Ave
- 3539 SW Battaglia Ave
- 1441 SW 23rd Ct
- 3644 SW Battaglia Ave
- 3510 SW Binford Ave
- 3542 SW Binford Ave
- 3650 SW Binford Ave
- 1261 SW Binford Lake Pkwy
- 1421 SW Binford Lake Pkwy
- 1960 SW 29th Dr
- 1990 SW 29th Dr
- 1936 SW 29th Dr
- 1996 SW 29th Dr
- 2890 SW Riverview Ct
- 1945 SW 29th Dr
- 1920 SW 29th Dr
- 2010 SW 29th Dr
- 2081 SW 30th Dr
- 2001 SW 29th Dr
- 2121 SW 30th Dr
- 2061 SW 30th Dr
- 2131 SW 30th Dr
- 2881 SW Willowbrook Ct
- 2021 SW 30th Dr
- 2860 SW Riverview Ct
- 1967 SW Willow Pkwy
- 1906 SW 29th Dr
- 2151 SW 30th Dr
- 2030 SW 29th Dr
Your Personal Tour Guide
Ask me questions while you tour the home.