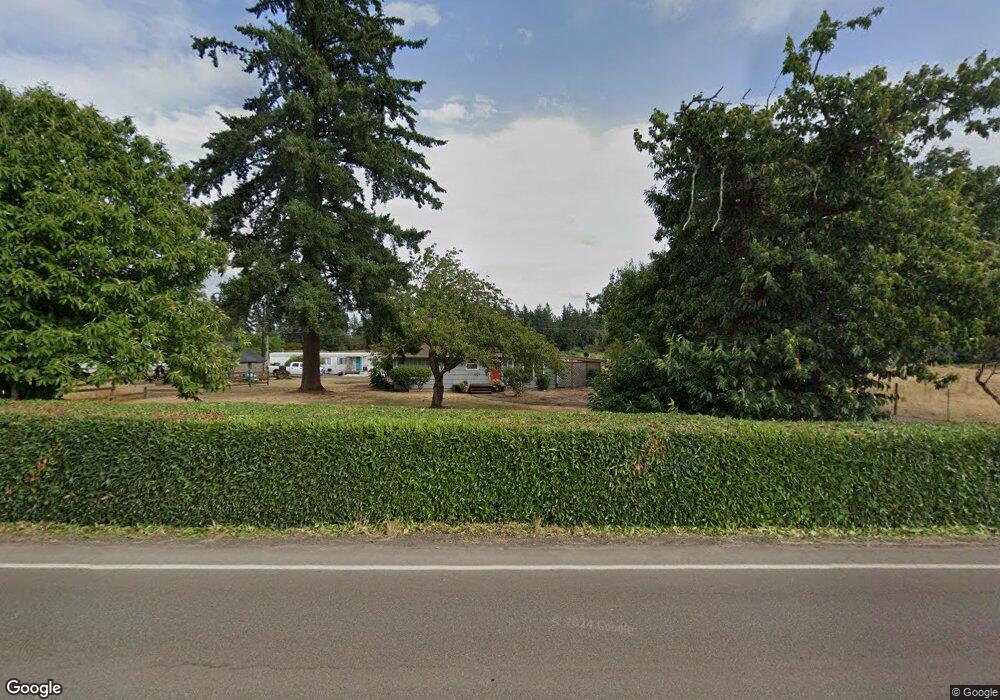
19868 S End Rd Oregon City, OR 97045
Estimated Value: $769,000 - $879,000
2
Beds
1
Bath
2,010
Sq Ft
$407/Sq Ft
Est. Value
About This Home
This home is located at 19868 S End Rd, Oregon City, OR 97045 and is currently estimated at $817,873, approximately $406 per square foot. 19868 S End Rd is a home located in Clackamas County with nearby schools including John McLoughlin Elementary School, Gardiner Middle School, and Oregon City Senior High School.
Ownership History
Date
Name
Owned For
Owner Type
Purchase Details
Closed on
Oct 3, 2024
Sold by
Manuel Ethan and Manuel Stephanie
Bought by
Silica Holdings Llc
Current Estimated Value
Purchase Details
Closed on
Sep 24, 2020
Sold by
Silver Brian and Silver Nancy J
Bought by
Manuel Ethan and Manuel Stephanie
Home Financials for this Owner
Home Financials are based on the most recent Mortgage that was taken out on this home.
Original Mortgage
$442,500
Interest Rate
2.9%
Mortgage Type
New Conventional
Purchase Details
Closed on
Feb 2, 2016
Sold by
Silver Brian and Silver Nancy J
Bought by
Silver Brian and Silver Nancy J
Purchase Details
Closed on
Jun 8, 1998
Sold by
Deljohnson R and Johnson Lori A
Bought by
Silver Brian and Silver Nancy J
Home Financials for this Owner
Home Financials are based on the most recent Mortgage that was taken out on this home.
Original Mortgage
$163,000
Interest Rate
7.17%
Create a Home Valuation Report for This Property
The Home Valuation Report is an in-depth analysis detailing your home's value as well as a comparison with similar homes in the area
Home Values in the Area
Average Home Value in this Area
Purchase History
| Date | Buyer | Sale Price | Title Company |
|---|---|---|---|
| Silica Holdings Llc | -- | None Listed On Document | |
| Manuel Ethan | $590,000 | First American | |
| Silver Brian | -- | None Available | |
| Silver Brian | $220,000 | First American Title Ins Co |
Source: Public Records
Mortgage History
| Date | Status | Borrower | Loan Amount |
|---|---|---|---|
| Previous Owner | Manuel Ethan | $442,500 | |
| Previous Owner | Silver Brian | $163,000 |
Source: Public Records
Tax History Compared to Growth
Tax History
| Year | Tax Paid | Tax Assessment Tax Assessment Total Assessment is a certain percentage of the fair market value that is determined by local assessors to be the total taxable value of land and additions on the property. | Land | Improvement |
|---|---|---|---|---|
| 2024 | $6,169 | $414,539 | -- | -- |
| 2023 | $6,169 | $402,466 | $0 | $0 |
| 2022 | $5,640 | $390,744 | $0 | $0 |
| 2021 | $9,979 | $379,364 | $0 | $0 |
| 2020 | $5,243 | $368,315 | $0 | $0 |
| 2019 | $5,144 | $357,588 | $0 | $0 |
| 2018 | $4,860 | $347,173 | $0 | $0 |
| 2017 | $4,738 | $337,061 | $0 | $0 |
| 2016 | $4,636 | $327,244 | $0 | $0 |
| 2015 | $4,445 | $317,713 | $0 | $0 |
| 2014 | $4,218 | $308,459 | $0 | $0 |
Source: Public Records
Map
Nearby Homes
- 19600 S End Rd
- 11300 Finnegans Way
- 11231 S Parkland Ct
- 19477 Hummingbird Loop
- 20721 S May Rd
- 21303 S Central Point Rd
- 19149 S End Rd
- 18843 Chanelle Way
- 19370 Westwood Dr
- 11427 Sprite Way
- 18969 Lafayette Ave
- 18830 Highway 99e Unit 41
- 18830 S Highway 99 E Unit 34
- 1224 Lafayette Ave
- 19457 Sunset Springs Dr
- 19338 Inishbride Ct
- 0 S End Rd
- 10285 S New Era Rd
- 10202 S New Era Rd
- 12708 Aspenwood Ln
- 19872 S End Rd
- 19955 Impala Ln
- 19957 S End Rd
- 1 S Call Ln
- 10799 S Kelland Ct
- 19940 Impala Ln
- 19799 S South End Rd
- 19910 Impala Ln Unit PEN
- 19910 S Impala Ln
- 19750 S End Rd
- 19910 Impala Ln
- 19985 S South End Rd
- 19888 Impala Ln
- 19838 Impala Ln
- 19838 Impala Ln
- 19888 S Impala Ln
- 19985 S End Rd
- 10774 S Kelland Ct
- 19780 S End Rd
- 19793 S End Rd