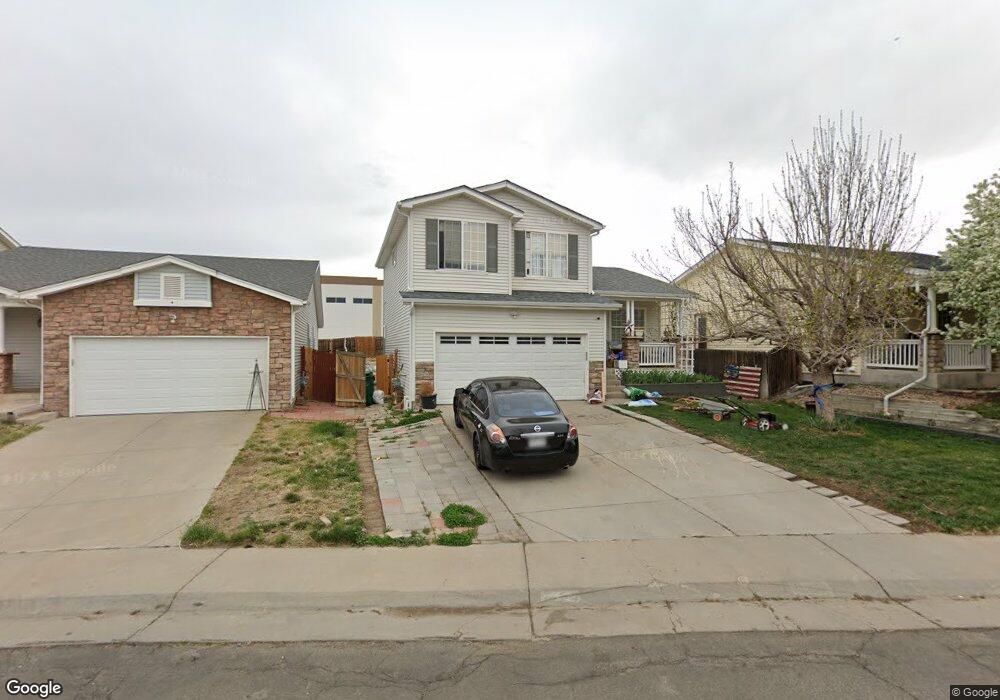
19869 Montview Dr Aurora, CO 80011
Tower Triangle NeighborhoodEstimated Value: $463,000 - $482,000
4
Beds
4
Baths
1,764
Sq Ft
$268/Sq Ft
Est. Value
About This Home
This home is located at 19869 Montview Dr, Aurora, CO 80011 and is currently estimated at $472,154, approximately $267 per square foot. 19869 Montview Dr is a home located in Adams County with nearby schools including Clyde Miller K-8, Vista Peak 9-12 Preparatory, and KIPP Northeast Elementary.
Ownership History
Date
Name
Owned For
Owner Type
Purchase Details
Closed on
Jan 19, 2016
Sold by
Comandari John Steve
Bought by
Martin Randell William and Martin Donna Kay
Current Estimated Value
Home Financials for this Owner
Home Financials are based on the most recent Mortgage that was taken out on this home.
Original Mortgage
$268,580
Outstanding Balance
$213,747
Interest Rate
3.98%
Mortgage Type
New Conventional
Estimated Equity
$258,407
Purchase Details
Closed on
Aug 28, 2009
Sold by
Morris Tyree and Morris Janine
Bought by
Comandari John Steve
Home Financials for this Owner
Home Financials are based on the most recent Mortgage that was taken out on this home.
Original Mortgage
$125,681
Interest Rate
5.2%
Mortgage Type
FHA
Purchase Details
Closed on
Aug 24, 1999
Sold by
Centex Homes
Bought by
Morris Tyree and Morris Janine
Home Financials for this Owner
Home Financials are based on the most recent Mortgage that was taken out on this home.
Original Mortgage
$135,439
Interest Rate
7.65%
Mortgage Type
FHA
Create a Home Valuation Report for This Property
The Home Valuation Report is an in-depth analysis detailing your home's value as well as a comparison with similar homes in the area
Home Values in the Area
Average Home Value in this Area
Purchase History
| Date | Buyer | Sale Price | Title Company |
|---|---|---|---|
| Martin Randell William | $260,000 | Fidelity National Title Ins | |
| Comandari John Steve | $128,000 | 1Dt | |
| Morris Tyree | $136,345 | North American Title |
Source: Public Records
Mortgage History
| Date | Status | Borrower | Loan Amount |
|---|---|---|---|
| Open | Martin Randell William | $268,580 | |
| Previous Owner | Comandari John Steve | $125,681 | |
| Previous Owner | Morris Tyree | $135,439 |
Source: Public Records
Tax History Compared to Growth
Tax History
| Year | Tax Paid | Tax Assessment Tax Assessment Total Assessment is a certain percentage of the fair market value that is determined by local assessors to be the total taxable value of land and additions on the property. | Land | Improvement |
|---|---|---|---|---|
| 2024 | $3,200 | $29,060 | $5,250 | $23,810 |
| 2023 | $3,251 | $34,230 | $5,680 | $28,550 |
| 2022 | $2,954 | $24,950 | $5,840 | $19,110 |
| 2021 | $2,954 | $24,950 | $5,840 | $19,110 |
| 2020 | $3,134 | $26,560 | $6,010 | $20,550 |
| 2019 | $3,129 | $26,560 | $6,010 | $20,550 |
| 2018 | $2,438 | $20,610 | $4,680 | $15,930 |
| 2017 | $2,166 | $20,610 | $4,680 | $15,930 |
| 2016 | $1,578 | $14,890 | $2,950 | $11,940 |
| 2015 | $1,528 | $14,890 | $2,950 | $11,940 |
| 2014 | $1,167 | $11,190 | $2,230 | $8,960 |
Source: Public Records
Map
Nearby Homes
- 19727 Montview Dr
- 19542 E 19th Place
- 19537 E 18th Ave
- 19524 Montview Dr
- 1914 Ensenada Ct
- 1943 Ensenada Ct
- 1687 Ensenada Way
- 1685 Ensenada Way
- 2039 Espana Way
- 19958 E Batavia Dr
- 20503 E Batavia Dr
- 20601 E Buchanan Dr
- 1958 Cathay Ct
- 1956 Cathay St
- 19033 E 22nd Cir
- 1701 Biscay St
- 24121 E 30th Ave
- 24101 E 30th Ave
- 21861 E 26th Ave
- 17546 E Batavia Place
- 19859 Montview Dr
- 19899 Montview Dr
- 19839 Montview Dr
- 19829 Montview Dr
- 19921 Montview Dr
- 19860 Montview Dr
- 19911 Montview Dr
- 19870 Montview Dr
- 19840 Montview Dr
- 19809 Montview Dr
- 19890 Montview Dr
- 19941 Montview Dr
- 19830 Montview Dr
- 19900 Montview Dr
- 19797 Montview Dr
- 19810 Montview Dr
- 19902 Montview Dr
- 19798 Montview Dr
- 19787 Montview Dr
- 19912 Montview Dr