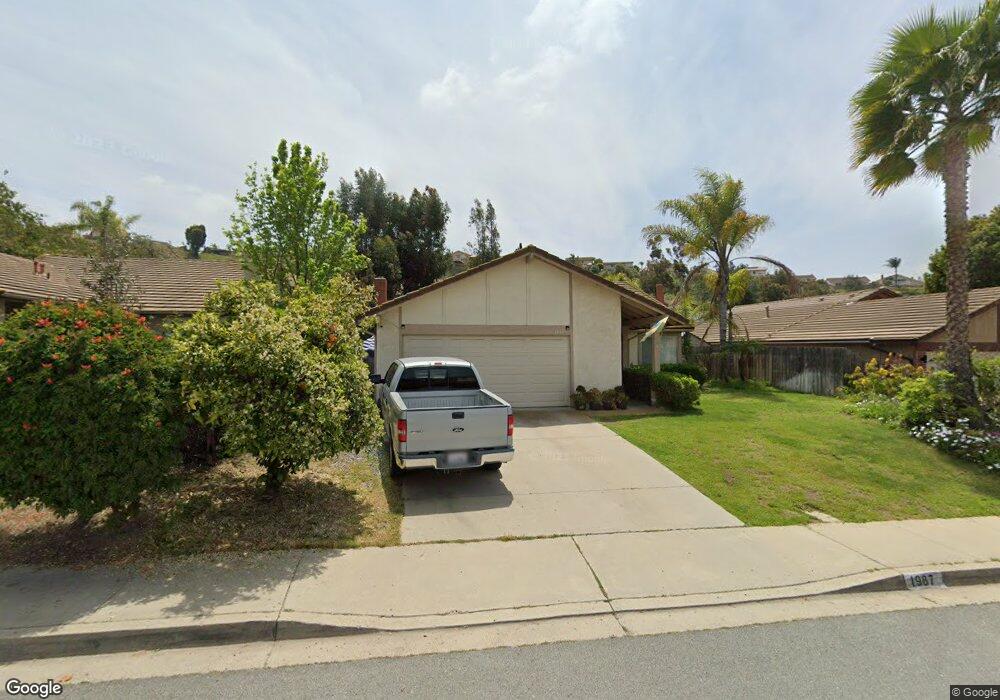
1987 Elva St El Cajon, CA 92019
Rancho Park NeighborhoodEstimated Value: $813,603 - $949,000
3
Beds
2
Baths
1,251
Sq Ft
$709/Sq Ft
Est. Value
About This Home
This home is located at 1987 Elva St, El Cajon, CA 92019 and is currently estimated at $887,151, approximately $709 per square foot. 1987 Elva St is a home located in San Diego County with nearby schools including Vista Grande Elementary, Hillsdale Middle School, and Valhalla High.
Ownership History
Date
Name
Owned For
Owner Type
Purchase Details
Closed on
Oct 15, 2010
Sold by
Lupo Matthew and Lupo Frances
Bought by
Lupo Matthew Anthony and Lupo Francesca Maria
Current Estimated Value
Purchase Details
Closed on
Sep 20, 2006
Sold by
Lupo Salvatore J and Lupo Mary Lee
Bought by
Lupo Salvatore Joseph and Lupo Mary Lee
Purchase Details
Closed on
Sep 5, 2000
Sold by
Delucia Vincent
Bought by
Lupo Salvatore J and Lupo Mary
Home Financials for this Owner
Home Financials are based on the most recent Mortgage that was taken out on this home.
Original Mortgage
$183,200
Outstanding Balance
$62,123
Interest Rate
7.12%
Estimated Equity
$825,028
Purchase Details
Closed on
Nov 23, 1993
Sold by
Delucia Vincent A and Delucia Gwendolyn M
Bought by
Delucia Vincent and Delucia Gwendolyn M
Purchase Details
Closed on
Sep 28, 1990
Purchase Details
Closed on
May 27, 1988
Purchase Details
Closed on
May 16, 1984
Create a Home Valuation Report for This Property
The Home Valuation Report is an in-depth analysis detailing your home's value as well as a comparison with similar homes in the area
Home Values in the Area
Average Home Value in this Area
Purchase History
| Date | Buyer | Sale Price | Title Company |
|---|---|---|---|
| Lupo Matthew Anthony | -- | None Available | |
| Lupo Salvatore Joseph | -- | None Available | |
| Lupo Salvatore J | $233,000 | Guardian Title Company | |
| Delucia Vincent | -- | -- | |
| Delucia Vincent | -- | -- | |
| -- | $188,500 | -- | |
| -- | $136,000 | -- | |
| -- | $96,500 | -- |
Source: Public Records
Mortgage History
| Date | Status | Borrower | Loan Amount |
|---|---|---|---|
| Open | Lupo Salvatore J | $183,200 |
Source: Public Records
Tax History
| Year | Tax Paid | Tax Assessment Tax Assessment Total Assessment is a certain percentage of the fair market value that is determined by local assessors to be the total taxable value of land and additions on the property. | Land | Improvement |
|---|---|---|---|---|
| 2025 | $4,316 | $345,039 | $156,834 | $188,205 |
| 2024 | $4,316 | $338,274 | $153,759 | $184,515 |
| 2023 | $4,204 | $331,643 | $150,745 | $180,898 |
| 2022 | $4,134 | $325,141 | $147,790 | $177,351 |
| 2021 | $4,078 | $318,767 | $144,893 | $173,874 |
| 2020 | $3,995 | $315,500 | $143,408 | $172,092 |
| 2019 | $3,949 | $309,315 | $140,597 | $168,718 |
| 2018 | $3,886 | $303,251 | $137,841 | $165,410 |
| 2017 | $3,838 | $297,306 | $135,139 | $162,167 |
| 2016 | $3,690 | $291,478 | $132,490 | $158,988 |
| 2015 | $3,665 | $287,100 | $130,500 | $156,600 |
| 2014 | $3,596 | $281,477 | $127,944 | $153,533 |
Source: Public Records
Map
Nearby Homes
- 2026 Capri Ct
- 2552 Wind River Rd
- 2075 Pierce Ct
- 1781 Colter Lake Ct
- 2030 Seca St
- 2049 Wind River Rd
- 2846 Willow Glen Dr
- 2011 Monarch Ridge Cir
- 1810 Hillsdale Rd Unit 94
- 1975 Julianna St
- 2450 Sawgrass St
- 12092 Calle de Leon Unit 45
- 0 Hillsdale Rd Unit PTP2601192
- 12083 Calle de Montana Unit 219
- 12046 Calle de Montana Unit 274
- 1525 Fair Glen Rd
- 1423 Vista Grande Rd
- 1426 Hidden Mesa View Dr
- 11438 Via Rancho San Diego Unit 141
- 1574 Shadow Knolls Dr
- 1991 Elva St
- 1979 Elva St
- 2061 Darlington Ct
- 1997 Elva St
- 2037 Darlington Ct
- 2069 Darlington Ct
- 1990 Elva St
- 1982 Elva St
- 2075 Darlington Ct
- 2003 Elva St
- 1996 Elva St
- 1974 Elva St
- 2006 Darlington Ct
- 2014 Darlington Ct
- 1966 Elva St
- 2022 Darlington Ct
- 2081 Darlington Ct
- 2008 Elva St
- 1958 Elva St
- 2030 Darlington Ct
Your Personal Tour Guide
Ask me questions while you tour the home.