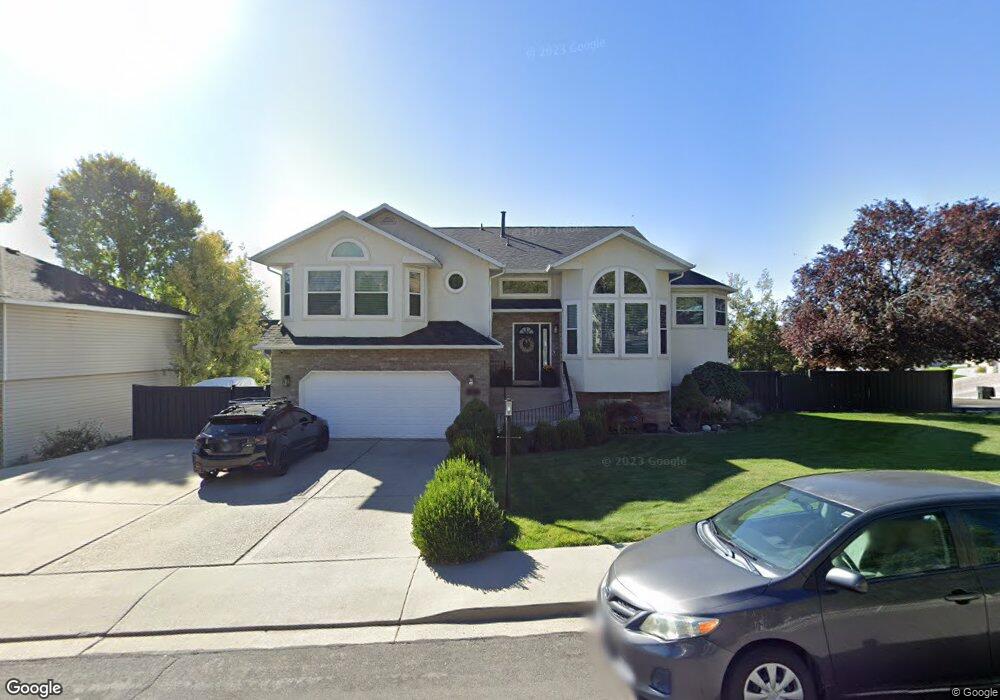
1987 N 540 E Orem, UT 84097
Northridge NeighborhoodEstimated Value: $629,000 - $761,000
5
Beds
3
Baths
3,080
Sq Ft
$230/Sq Ft
Est. Value
About This Home
This home is located at 1987 N 540 E, Orem, UT 84097 and is currently estimated at $709,485, approximately $230 per square foot. 1987 N 540 E is a home located in Utah County with nearby schools including Northridge Elementary School, Oak Canyon Junior High School, and Timpanogos High School.
Ownership History
Date
Name
Owned For
Owner Type
Purchase Details
Closed on
Nov 30, 2020
Sold by
Brown Deanna
Bought by
Brown Deanna W and Rdb Living Trust
Current Estimated Value
Home Financials for this Owner
Home Financials are based on the most recent Mortgage that was taken out on this home.
Original Mortgage
$238,100
Interest Rate
2.8%
Mortgage Type
New Conventional
Purchase Details
Closed on
Jun 26, 2019
Sold by
Brown Deanna W
Bought by
Brown Deanna W and Rdb Living Trust
Purchase Details
Closed on
Aug 16, 2001
Sold by
Brown Ryan R
Bought by
Brown Ryan R and Brown Deanna W
Home Financials for this Owner
Home Financials are based on the most recent Mortgage that was taken out on this home.
Original Mortgage
$306,000
Interest Rate
7.21%
Create a Home Valuation Report for This Property
The Home Valuation Report is an in-depth analysis detailing your home's value as well as a comparison with similar homes in the area
Home Values in the Area
Average Home Value in this Area
Purchase History
| Date | Buyer | Sale Price | Title Company |
|---|---|---|---|
| Brown Deanna W | -- | Cottonwood Title Ins Agcy In | |
| Brown Deanna | -- | Cottonwood Title Ins Agcy In | |
| Brown Deanna W | -- | None Available | |
| Brown Ryan R | -- | Century Title | |
| Brown Ryan R | -- | Century Title |
Source: Public Records
Mortgage History
| Date | Status | Borrower | Loan Amount |
|---|---|---|---|
| Closed | Brown Deanna | $238,100 | |
| Closed | Brown Ryan R | $306,000 |
Source: Public Records
Tax History
| Year | Tax Paid | Tax Assessment Tax Assessment Total Assessment is a certain percentage of the fair market value that is determined by local assessors to be the total taxable value of land and additions on the property. | Land | Improvement |
|---|---|---|---|---|
| 2025 | $2,777 | $375,155 | -- | -- |
| 2024 | $2,777 | $339,625 | $0 | $0 |
| 2023 | $2,613 | $343,420 | $0 | $0 |
| 2022 | $2,920 | $371,800 | $0 | $0 |
| 2021 | $2,651 | $511,300 | $178,900 | $332,400 |
| 2020 | $2,491 | $472,200 | $155,600 | $316,600 |
| 2019 | $2,131 | $420,000 | $144,700 | $275,300 |
| 2018 | $2,230 | $420,000 | $144,700 | $275,300 |
| 2017 | $2,231 | $225,060 | $0 | $0 |
| 2016 | $2,411 | $224,235 | $0 | $0 |
| 2015 | $2,324 | $204,490 | $0 | $0 |
| 2014 | $2,276 | $199,320 | $0 | $0 |
Source: Public Records
Map
Nearby Homes
- 1051 E 100 N
- 1643 N Mountain Oaks Dr
- 193 E 1570 N
- 363 E 1395 N Unit 22
- 713 E 1500 St N Unit 19
- 713 E 1450 N Unit 23
- 1371 N 330 E Unit 8
- 1366 N 750 E Unit LOT 12
- 1356 N 750 E Unit 11
- 733 E 1450 N Unit 5
- 687 E 175 N
- 1324 N 750 E Unit 3
- 87 W 1525 N
- 790 E 400 N
- 372 E 1165 N
- 127 S 400 E
- 1547 N 275 West St Unit 5
- 1987 N 400 W
- 442 W 1950 North St
- 332 W Amiron Way Unit D
Your Personal Tour Guide
Ask me questions while you tour the home.