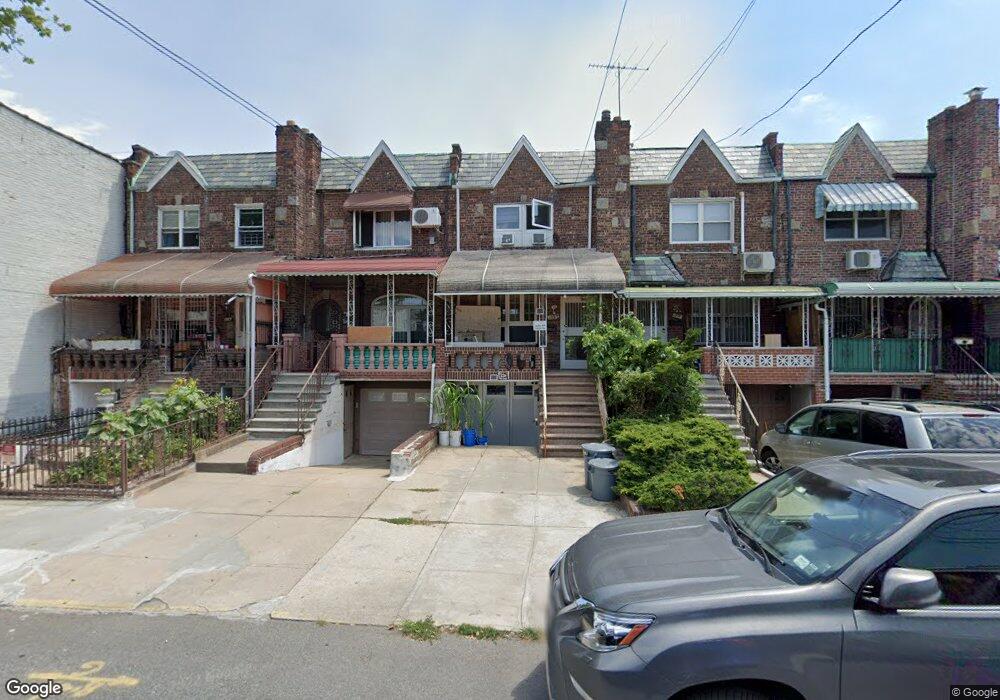
1987 W 11th St Brooklyn, NY 11223
Gravesend NeighborhoodEstimated Value: $942,000 - $1,037,000
--
Bed
--
Bath
1,320
Sq Ft
$736/Sq Ft
Est. Value
About This Home
This home is located at 1987 W 11th St, Brooklyn, NY 11223 and is currently estimated at $971,470, approximately $735 per square foot. 1987 W 11th St is a home located in Kings County with nearby schools including P.S. 97 - The Highlawn, Is 228 David A Boody, and Hebrew Language Academy Charter 2.
Ownership History
Date
Name
Owned For
Owner Type
Purchase Details
Closed on
Jul 29, 2016
Sold by
Lu Yan Ting
Bought by
Lu Yan Jun and Lu Yan Ting
Current Estimated Value
Purchase Details
Closed on
Mar 27, 2014
Sold by
Solfanelli Grace
Bought by
Lu Yan Ting
Home Financials for this Owner
Home Financials are based on the most recent Mortgage that was taken out on this home.
Original Mortgage
$360,000
Interest Rate
4.37%
Mortgage Type
New Conventional
Create a Home Valuation Report for This Property
The Home Valuation Report is an in-depth analysis detailing your home's value as well as a comparison with similar homes in the area
Home Values in the Area
Average Home Value in this Area
Purchase History
| Date | Buyer | Sale Price | Title Company |
|---|---|---|---|
| Lu Yan Jun | -- | -- | |
| Lu Yan Ting | $568,500 | -- |
Source: Public Records
Mortgage History
| Date | Status | Borrower | Loan Amount |
|---|---|---|---|
| Previous Owner | Lu Yan Ting | $360,000 |
Source: Public Records
Tax History Compared to Growth
Tax History
| Year | Tax Paid | Tax Assessment Tax Assessment Total Assessment is a certain percentage of the fair market value that is determined by local assessors to be the total taxable value of land and additions on the property. | Land | Improvement |
|---|---|---|---|---|
| 2025 | $6,800 | $61,080 | $11,100 | $49,980 |
| 2024 | $6,800 | $48,240 | $11,100 | $37,140 |
| 2023 | $6,526 | $57,840 | $11,100 | $46,740 |
| 2022 | $5,749 | $55,560 | $11,100 | $44,460 |
| 2021 | $6,001 | $51,180 | $11,100 | $40,080 |
| 2020 | $6,045 | $46,680 | $11,100 | $35,580 |
| 2019 | $5,853 | $51,600 | $11,100 | $40,500 |
| 2018 | $5,399 | $27,945 | $6,446 | $21,499 |
| 2017 | $5,105 | $26,512 | $7,027 | $19,485 |
| 2016 | $4,704 | $25,081 | $7,682 | $17,399 |
| 2015 | $2,797 | $25,081 | $10,566 | $14,515 |
| 2014 | $2,797 | $24,482 | $10,313 | $14,169 |
Source: Public Records
Map
Nearby Homes
- 1989 W 11th St
- 1985 W 11th St
- 1991 W 11th St
- 1983 W 11th St
- 1983 W 11th St Unit 1
- 1993 W 11th St
- 1981 W 11th St
- 1995 W 11th St
- 1977 W 11th St
- 1988 W 10th St
- 1986 W 10th St
- 1990 W 10th St
- 1984 W 10th St
- 1994 W 10th St
- 1980 W 10th St
- 1996 W 10th St
- 1971 W 11th St
- 1978 W 10th St
- 1976 W 10th St
- 1969 W 11th St