Estimated Value: $190,000 - $212,000
4
Beds
2
Baths
1,299
Sq Ft
$153/Sq Ft
Est. Value
About This Home
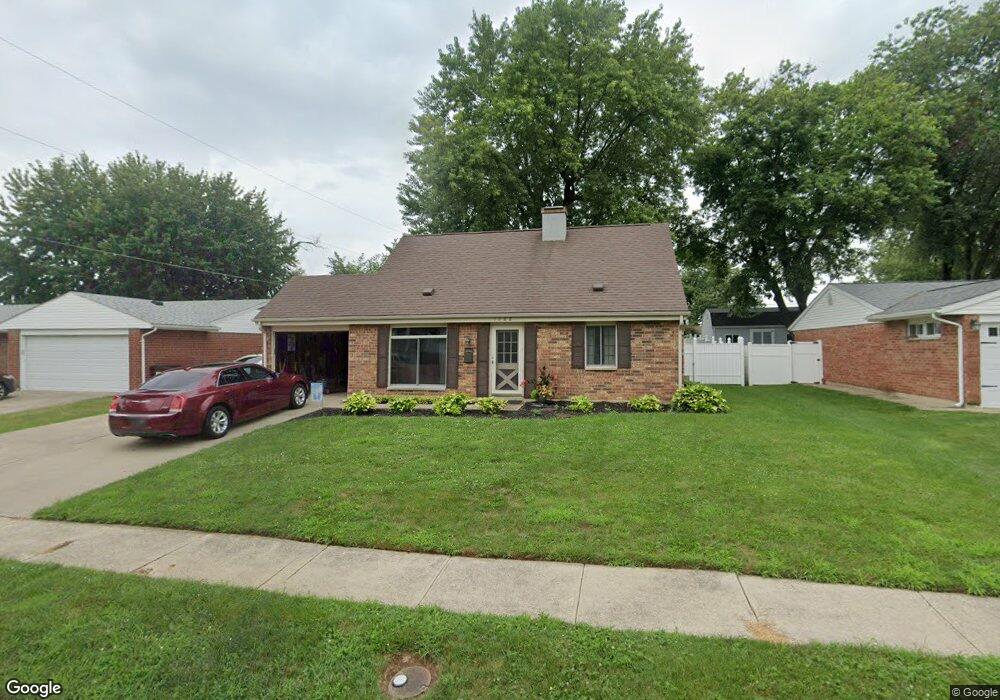
This home is located at 1988 Connecticut Dr, Xenia, OH 45385 and is currently estimated at $198,220, approximately $152 per square foot. 1988 Connecticut Dr is a home located in Greene County with nearby schools including Xenia High School and Summit Academy Community School for Alternative Learners - Xenia.
Ownership History
Date
Name
Owned For
Owner Type
Purchase Details
Closed on
May 28, 2021
Sold by
Salyers Kristin D and Salyers Steven M
Bought by
Salyers Kristin D and Salyers Steven M
Current Estimated Value
Home Financials for this Owner
Home Financials are based on the most recent Mortgage that was taken out on this home.
Original Mortgage
$74,200
Outstanding Balance
$56,337
Interest Rate
2.9%
Mortgage Type
New Conventional
Estimated Equity
$141,883
Purchase Details
Closed on
Dec 1, 2017
Sold by
Spin Daniel
Bought by
Spin Kristin
Purchase Details
Closed on
Jul 13, 2009
Sold by
Siebel Michael A and Siebel Cynthia S
Bought by
Hilderbrand Kristin D
Home Financials for this Owner
Home Financials are based on the most recent Mortgage that was taken out on this home.
Original Mortgage
$92,297
Interest Rate
4.85%
Mortgage Type
FHA
Purchase Details
Closed on
May 28, 2009
Sold by
Tracy Geroge E and Tracy Doris E
Bought by
Hilerbrand Kristin D and Siebel Michael A
Home Financials for this Owner
Home Financials are based on the most recent Mortgage that was taken out on this home.
Original Mortgage
$92,297
Interest Rate
4.85%
Mortgage Type
FHA
Create a Home Valuation Report for This Property
The Home Valuation Report is an in-depth analysis detailing your home's value as well as a comparison with similar homes in the area
Home Values in the Area
Average Home Value in this Area
Purchase History
| Date | Buyer | Sale Price | Title Company |
|---|---|---|---|
| Salyers Kristin D | -- | Agility Closing & Ttl Svcs I | |
| Spin Kristin | -- | -- | |
| Hilderbrand Kristin D | -- | None Available | |
| Hilerbrand Kristin D | $94,000 | Midwest Title Company |
Source: Public Records
Mortgage History
| Date | Status | Borrower | Loan Amount |
|---|---|---|---|
| Open | Salyers Kristin D | $74,200 | |
| Previous Owner | Hilerbrand Kristin D | $92,297 |
Source: Public Records
Tax History Compared to Growth
Tax History
| Year | Tax Paid | Tax Assessment Tax Assessment Total Assessment is a certain percentage of the fair market value that is determined by local assessors to be the total taxable value of land and additions on the property. | Land | Improvement |
|---|---|---|---|---|
| 2024 | $2,153 | $50,320 | $10,680 | $39,640 |
| 2023 | $2,153 | $50,320 | $10,680 | $39,640 |
| 2022 | $1,799 | $35,860 | $6,280 | $29,580 |
| 2021 | $1,823 | $35,860 | $6,280 | $29,580 |
| 2020 | $1,747 | $35,860 | $6,280 | $29,580 |
| 2019 | $1,609 | $31,100 | $6,240 | $24,860 |
| 2018 | $1,616 | $31,100 | $6,240 | $24,860 |
| 2017 | $1,490 | $31,100 | $6,240 | $24,860 |
| 2016 | $1,491 | $28,160 | $6,240 | $21,920 |
| 2015 | $1,495 | $28,160 | $6,240 | $21,920 |
| 2014 | $1,431 | $28,160 | $6,240 | $21,920 |
Source: Public Records
Map
Nearby Homes
- 2142 Michigan Dr
- 414 Whisper Ln
- 1769 Gayhart Dr
- 2758 Wyoming Dr
- 1653 Seneca Dr
- 2545 Harmony Dr
- 1829 Gayhart Dr
- 2257 Maryland Dr
- 219 Kansas Dr
- 161 Montana Dr
- 1403 Texas Dr
- 1778 Arapaho Dr
- 1568 Cheyenne Dr
- 1255 Colorado Dr
- 1866 Roxbury Dr
- 2345 Tennessee Dr
- 2499 Jenny Marie Dr
- 2421 Louisiana Dr
- 2540 Jenny Marie Dr
- 1144 Rockwell Dr
- 2002 Connecticut Dr
- 1983 Vermont Dr
- 1969 Vermont Dr
- 1997 Vermont Dr
- 1999 Connecticut Dr
- 1955 Vermont Dr
- 1985 Connecticut Dr
- 2013 Connecticut Dr
- 1946 Connecticut Dr
- 1971 Connecticut Dr
- 588 Wisconsin Dr
- 1941 Vermont Dr
- 574 Wisconsin Dr
- 602 Wisconsin Dr
- 1957 Connecticut Dr
- 560 Wisconsin Dr
- 1932 Connecticut Dr
- 616 Wisconsin Dr
- 1998 Florida Dr
- 1986 Vermont Dr