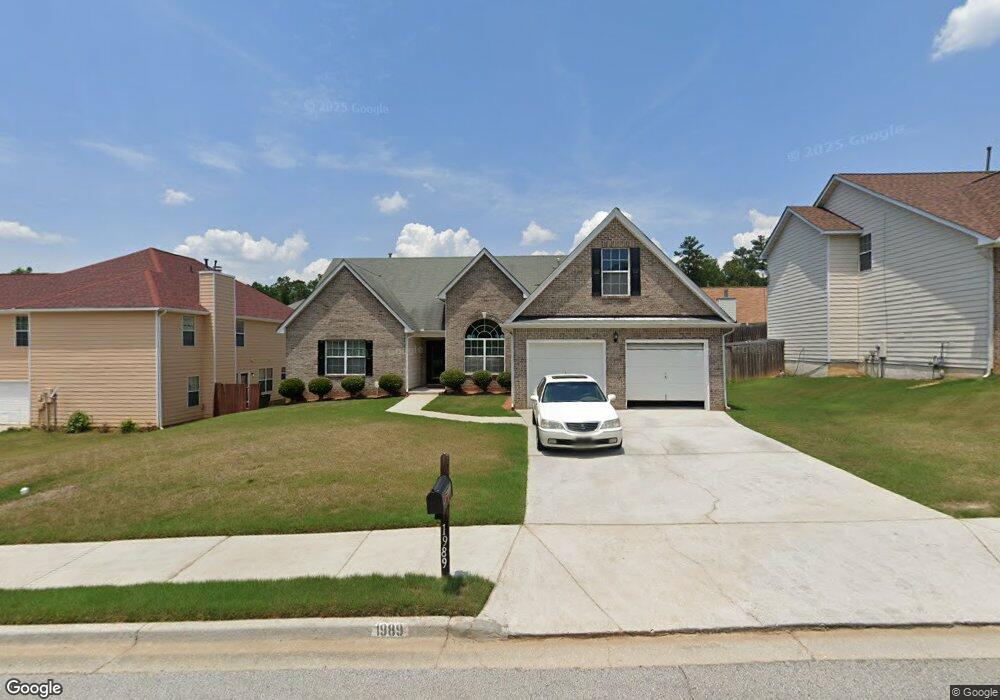
1989 Bridgestone Cir Conyers, GA 30012
Estimated Value: $296,000 - $336,000
4
Beds
3
Baths
2,085
Sq Ft
$152/Sq Ft
Est. Value
About This Home
This home is located at 1989 Bridgestone Cir, Conyers, GA 30012 and is currently estimated at $316,533, approximately $151 per square foot. 1989 Bridgestone Cir is a home located in Rockdale County with nearby schools including Hicks Elementary School, Conyers Middle School, and Rockdale County High School.
Ownership History
Date
Name
Owned For
Owner Type
Purchase Details
Closed on
Dec 7, 2021
Sold by
Fears Angela M
Bought by
Fears Angela Meshell and Harris Cynthia Y
Current Estimated Value
Purchase Details
Closed on
Jul 10, 2008
Sold by
Barber David
Bought by
Act Properties Llc
Purchase Details
Closed on
Jun 1, 2006
Sold by
Legacy Cmtys Of Bridgestone Vi
Bought by
Barber David
Home Financials for this Owner
Home Financials are based on the most recent Mortgage that was taken out on this home.
Original Mortgage
$184,290
Interest Rate
9.14%
Mortgage Type
New Conventional
Purchase Details
Closed on
Mar 31, 2005
Sold by
Act Properties Llc
Bought by
Fears Angela M
Home Financials for this Owner
Home Financials are based on the most recent Mortgage that was taken out on this home.
Original Mortgage
$116,342
Interest Rate
5.14%
Mortgage Type
FHA
Create a Home Valuation Report for This Property
The Home Valuation Report is an in-depth analysis detailing your home's value as well as a comparison with similar homes in the area
Home Values in the Area
Average Home Value in this Area
Purchase History
| Date | Buyer | Sale Price | Title Company |
|---|---|---|---|
| Fears Angela Meshell | -- | -- | |
| Act Properties Llc | $184,290 | -- | |
| Barber David | $184,300 | -- | |
| Fears Angela M | $110,000 | -- |
Source: Public Records
Mortgage History
| Date | Status | Borrower | Loan Amount |
|---|---|---|---|
| Previous Owner | Barber David | $184,290 | |
| Previous Owner | Fears Angela M | $116,342 |
Source: Public Records
Tax History Compared to Growth
Tax History
| Year | Tax Paid | Tax Assessment Tax Assessment Total Assessment is a certain percentage of the fair market value that is determined by local assessors to be the total taxable value of land and additions on the property. | Land | Improvement |
|---|---|---|---|---|
| 2024 | $4,184 | $109,840 | $27,720 | $82,120 |
| 2023 | $4,088 | $108,120 | $26,800 | $81,320 |
| 2022 | $3,402 | $90,520 | $20,960 | $69,560 |
| 2021 | $3,092 | $78,960 | $18,800 | $60,160 |
| 2020 | $2,902 | $70,920 | $16,000 | $54,920 |
| 2019 | $1,998 | $50,800 | $8,800 | $42,000 |
| 2018 | $1,108 | $50,800 | $8,800 | $42,000 |
| 2017 | $1,430 | $41,160 | $10,400 | $30,760 |
| 2016 | $1,289 | $39,240 | $7,200 | $32,040 |
| 2015 | $704 | $39,240 | $7,200 | $32,040 |
| 2014 | $523 | $35,040 | $6,400 | $28,640 |
| 2013 | -- | $42,720 | $8,800 | $33,920 |
Source: Public Records
Map
Nearby Homes
- 1962 Bridgestone Cir
- 1666 E Brook Dr
- 1669 E Brook Dr
- 1598 Renaissance Dr NE
- 1469 Cliff View Terrace
- 1640 Andalusian Way
- 1260 Brookstone Cir
- 1262 Brookstone Cir
- 1526 Battle Brook Dr
- 2131 Bridgestone Business Pkwy
- 1903 Cobblestone Ct
- 1308 Brookstone Lake Dr
- 1217 Brookstone Cir
- 1782 Green St NE
- 1847 New St NE
- 1794 Spring St NE
- 1729 Spring St NE
- 1730 Spring St NE
- 1822 New St NE
- 1991 Bridgestone Cir
- 1979 Bridgestone Cir
- 1975 Bridgestone Cir
- 1977 Bridgestone Cir Unit 1977
- 1973 Bridgestone Cir
- 1993 Bridgestone Cir
- 1990 Bridgestone Cir
- 1992 Keystone Way
- 1992 Keystone Way Unit 21
- 1988 Bridgestone Cir
- 1466 Cliffview Terrace
- 1971 Bridgestone Cir
- 1986 Bridgestone Cir
- 1984 Bridgestone Cir
- 1995 Bridgestone Cir
- 1982 Bridgestone Cir
- 1969 Bridgestone Cir
- 1980 Bridgestone Cir
- 1914 Keystone Way
- 1915 Keystone Way