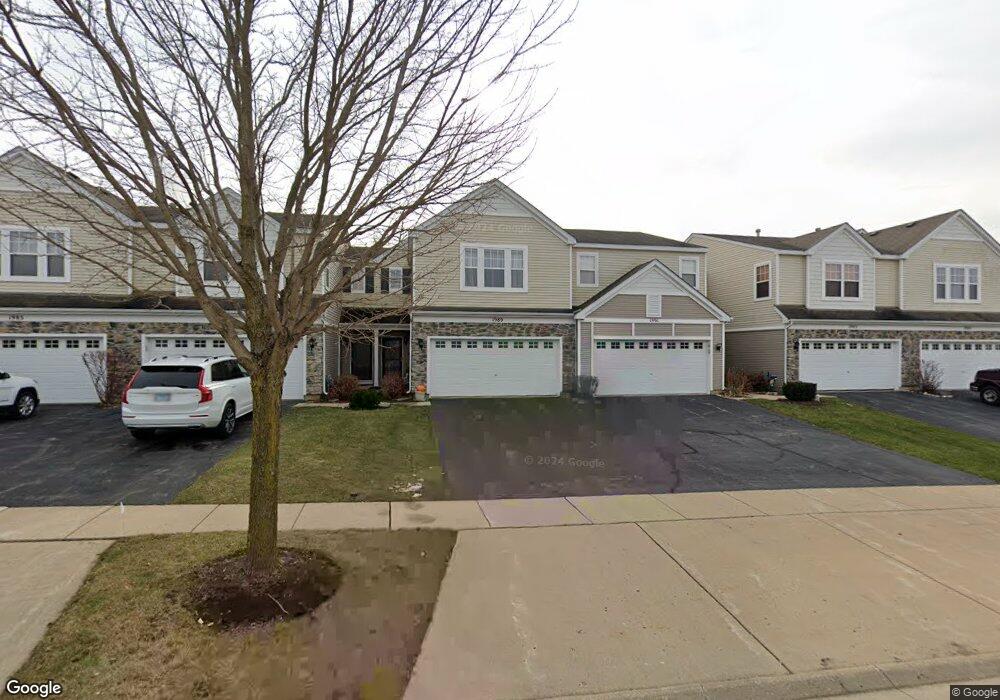
1989 Cobblestone Dr Unit 503 Carpentersville, IL 60110
Estimated Value: $295,000 - $308,000
2
Beds
3
Baths
1,552
Sq Ft
$194/Sq Ft
Est. Value
About This Home
This home is located at 1989 Cobblestone Dr Unit 503, Carpentersville, IL 60110 and is currently estimated at $300,870, approximately $193 per square foot. 1989 Cobblestone Dr Unit 503 is a home located in Kane County with nearby schools including Algonquin Lakes Elementary School, Algonquin Middle School, and Dundee-Crown High School.
Ownership History
Date
Name
Owned For
Owner Type
Purchase Details
Closed on
Dec 10, 2019
Sold by
Belezowski Kamil M and Kulig Belezowski Sylvia
Bought by
Kulaga Anna J and Kulaga Grzegorz J
Current Estimated Value
Home Financials for this Owner
Home Financials are based on the most recent Mortgage that was taken out on this home.
Original Mortgage
$178,125
Outstanding Balance
$157,043
Interest Rate
3.6%
Mortgage Type
New Conventional
Estimated Equity
$143,827
Purchase Details
Closed on
Mar 25, 2016
Sold by
Lee Young L
Bought by
Belczowski Kamil A
Home Financials for this Owner
Home Financials are based on the most recent Mortgage that was taken out on this home.
Original Mortgage
$139,428
Interest Rate
4.4%
Mortgage Type
FHA
Purchase Details
Closed on
Sep 10, 2003
Sold by
Centex Homes
Bought by
Lee Young L
Home Financials for this Owner
Home Financials are based on the most recent Mortgage that was taken out on this home.
Original Mortgage
$169,600
Interest Rate
4.5%
Mortgage Type
Purchase Money Mortgage
Create a Home Valuation Report for This Property
The Home Valuation Report is an in-depth analysis detailing your home's value as well as a comparison with similar homes in the area
Home Values in the Area
Average Home Value in this Area
Purchase History
| Date | Buyer | Sale Price | Title Company |
|---|---|---|---|
| Kulaga Anna J | $187,500 | None Available | |
| Belczowski Kamil A | $142,000 | Precision Title | |
| Lee Young L | $189,000 | Chicago Title Insurance Co |
Source: Public Records
Mortgage History
| Date | Status | Borrower | Loan Amount |
|---|---|---|---|
| Open | Kulaga Anna J | $178,125 | |
| Previous Owner | Belczowski Kamil A | $139,428 | |
| Previous Owner | Lee Young L | $169,600 |
Source: Public Records
Tax History Compared to Growth
Tax History
| Year | Tax Paid | Tax Assessment Tax Assessment Total Assessment is a certain percentage of the fair market value that is determined by local assessors to be the total taxable value of land and additions on the property. | Land | Improvement |
|---|---|---|---|---|
| 2024 | $5,052 | $74,707 | $9,631 | $65,076 |
| 2023 | $4,976 | $67,219 | $8,666 | $58,553 |
| 2022 | $5,159 | $65,252 | $8,666 | $56,586 |
| 2021 | $5,038 | $61,610 | $8,182 | $53,428 |
| 2020 | $4,954 | $60,225 | $7,998 | $52,227 |
| 2019 | $4,842 | $57,172 | $7,593 | $49,579 |
| 2018 | $4,576 | $52,108 | $7,443 | $44,665 |
| 2017 | $4,385 | $48,745 | $6,963 | $41,782 |
| 2016 | $4,800 | $43,628 | $6,742 | $36,886 |
| 2015 | -- | $37,246 | $6,317 | $30,929 |
| 2014 | -- | $36,218 | $6,143 | $30,075 |
| 2013 | -- | $37,327 | $6,331 | $30,996 |
Source: Public Records
Map
Nearby Homes
- 1551 Glacier Trail Unit 644
- 713 Silverstone Dr Unit 77
- 1309 Silverstone Dr Unit 1305
- 1303 Silverstone Dr Unit 1302
- 451 Mahogany Dr
- 460 Mahogany Dr
- 2245 Flagstone Ln Unit 155
- 2003 Magenta Ln
- 1431 Silverstone Dr Unit 1416
- 2260 Indigo Dr
- 2013 Silverstone Dr Unit 2013
- 601 Lake Cornish Way
- 2150 E Algonquin Rd
- 1811 IL Rte 25 (Elgin) Rd
- 400 Diamond Back Way
- 1670 Yosemite Pkwy
- 308 Amarillo Ct
- 1535 Teri Ln
- 1715 Riverwood Dr
- 200 Amarillo Dr
- 1993 Cobblestone Dr Unit 505
- 1991 Cobblestone Dr Unit 504
- 1995 Cobblestone Dr Unit 506
- 1989 Cobblestone Dr Unit 1989
- 1985 Cobblestone Dr Unit 501
- 1987 Cobblestone Dr Unit 502
- 1560 Glacier Trail Unit 516
- 1973 Cobblestone Dr Unit 491
- 1983 Cobblestone Dr Unit 496
- 1975 Cobblestone Dr Unit 492
- 1977 Cobblestone Dr Unit 493
- 1981 Cobblestone Dr Unit 495
- 1979 Cobblestone Dr Unit 494
- 1552 Glacier Trail Unit 524
- 1561 Glacier Trail Unit 661
- 1565 Glacier Trail Unit 663
- 1567 Glacier Trail Unit 664
- 1563 Glacier Trail Unit 662
- 1961 Cobblestone Dr Unit 481
- 1971 Cobblestone Dr Unit 486