Estimated Value: $191,000 - $256,000
2
Beds
1
Bath
656
Sq Ft
$343/Sq Ft
Est. Value
About This Home
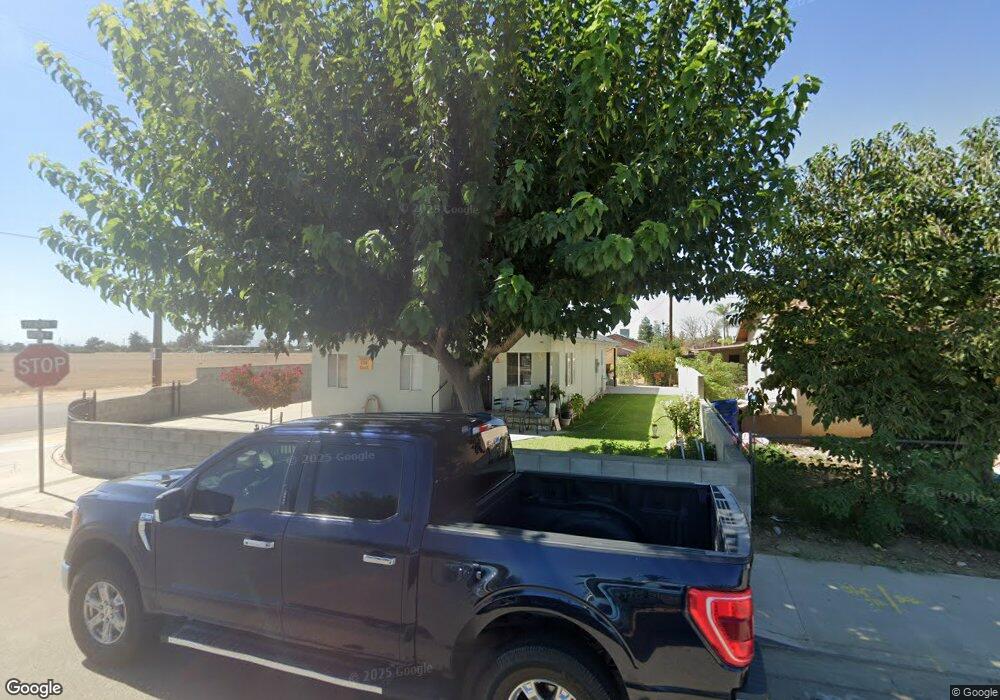
This home is located at 1989 Gaston St, Wasco, CA 93280 and is currently estimated at $224,737, approximately $342 per square foot. 1989 Gaston St is a home located in Kern County with nearby schools including Teresa Burke Elementary School, Thomas Jefferson Middle School, and Wasco High School.
Ownership History
Date
Name
Owned For
Owner Type
Purchase Details
Closed on
Jun 27, 2025
Sold by
Carrillo Maurilio
Bought by
Maurilio Carrillo Loera Revocable Living Trus and Loera
Current Estimated Value
Purchase Details
Closed on
May 28, 2025
Sold by
Carrillo Celedonia and Carrillo Maurilio
Bought by
Carrillo Maurilio
Purchase Details
Closed on
Jun 16, 1999
Sold by
Carrillo Maurillo and Carrillo Celedonia
Bought by
Carrillo Maurilio and Carrillo Celedonia
Home Financials for this Owner
Home Financials are based on the most recent Mortgage that was taken out on this home.
Original Mortgage
$43,401
Interest Rate
7.01%
Purchase Details
Closed on
May 24, 1994
Sold by
Carrillo Maurilio and Carrillo Celedonia
Bought by
Carrillo Maurilio and Carrillo Celedonia
Home Financials for this Owner
Home Financials are based on the most recent Mortgage that was taken out on this home.
Original Mortgage
$38,400
Interest Rate
8.57%
Create a Home Valuation Report for This Property
The Home Valuation Report is an in-depth analysis detailing your home's value as well as a comparison with similar homes in the area
Home Values in the Area
Average Home Value in this Area
Purchase History
| Date | Buyer | Sale Price | Title Company |
|---|---|---|---|
| Maurilio Carrillo Loera Revocable Living Trus | -- | None Listed On Document | |
| Carrillo Maurilio | -- | None Listed On Document | |
| Carrillo Maurilio | $22,000 | Commonwealth Title | |
| Carrillo Maurilio | -- | Chicago Title Company |
Source: Public Records
Mortgage History
| Date | Status | Borrower | Loan Amount |
|---|---|---|---|
| Previous Owner | Carrillo Maurilio | $43,401 | |
| Previous Owner | Carrillo Maurilio | $38,400 |
Source: Public Records
Tax History Compared to Growth
Tax History
| Year | Tax Paid | Tax Assessment Tax Assessment Total Assessment is a certain percentage of the fair market value that is determined by local assessors to be the total taxable value of land and additions on the property. | Land | Improvement |
|---|---|---|---|---|
| 2025 | $909 | $56,267 | $20,244 | $36,023 |
| 2024 | $909 | $55,164 | $19,847 | $35,317 |
| 2023 | $883 | $54,085 | $19,459 | $34,626 |
| 2022 | $831 | $53,024 | $19,077 | $33,947 |
| 2021 | $792 | $51,986 | $18,704 | $33,282 |
| 2020 | $734 | $51,453 | $18,512 | $32,941 |
| 2019 | $729 | $51,453 | $18,512 | $32,941 |
| 2018 | $731 | $49,457 | $17,794 | $31,663 |
| 2017 | $713 | $48,489 | $17,446 | $31,043 |
| 2016 | $659 | $47,539 | $17,104 | $30,435 |
| 2015 | $635 | $46,825 | $16,847 | $29,978 |
| 2014 | $614 | $45,909 | $16,518 | $29,391 |
Source: Public Records
Map
Nearby Homes
- 1867 Broadway St
- 1858 Broadway St
- 1857 Gaston St
- 1857 Fern Tree Close
- 1015 16th St
- 1533 Pine St
- 1807 Shamrock Ct
- 1541 Poppy Ct
- 0 Laredo St Unit 202508732
- 0 Laredo St Unit 202508731
- 1218 13th St
- 1245 Poso Dr
- 1750 Bay Meadows Dr
- 1425 G St
- 1065 12th St
- 1245 Broadway St
- 1034 11th St
- 1526 D St
- Lot 114 Track #1226
- 1034 Oak Ave
- 1981 Gaston St
- 1973 Gaston St
- 1988 Broadway St
- 1965 Gaston St
- 1984 Broadway St
- 1988 Gaston St
- 1980 Gaston St
- 1963 Gaston St
- 1982 Broadway St
- 1972 Gaston St
- 1964 Gaston St
- 1964 Broadway St
- 1953 Gaston St
- 1956 Gaston St
- 1954 Broadway St
- 1943 Gaston St
- 1977 Broadway St
- 1942 Gaston St
- 1989 D St
- 1967 Broadway St