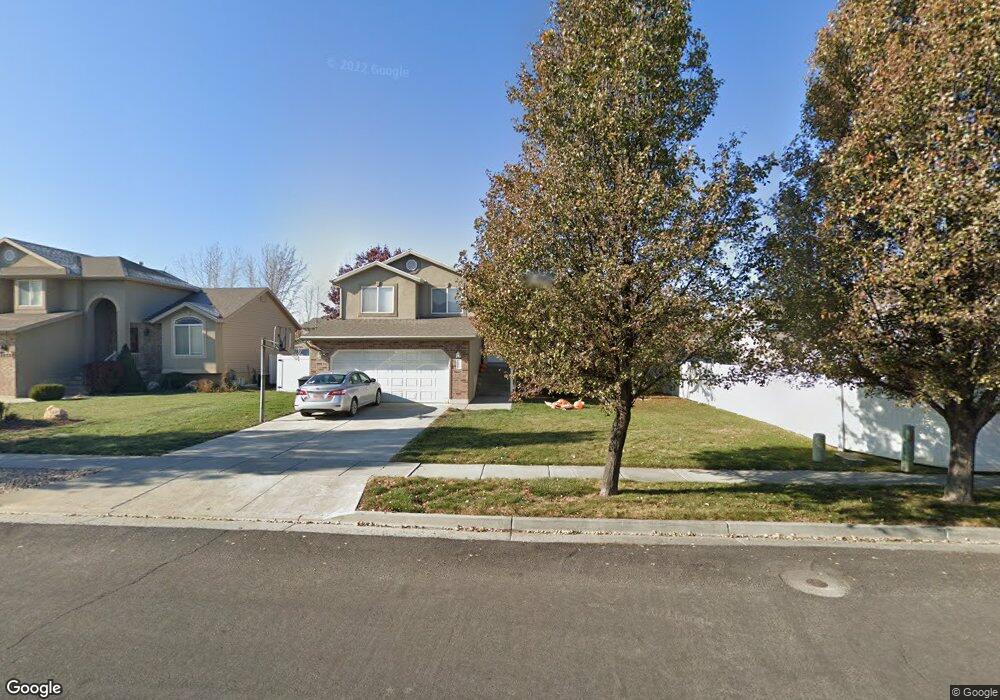
1989 N 2530 W Clearfield, UT 84015
Estimated Value: $472,000 - $542,000
4
Beds
4
Baths
2,160
Sq Ft
$233/Sq Ft
Est. Value
About This Home
This home is located at 1989 N 2530 W, Clearfield, UT 84015 and is currently estimated at $503,422, approximately $233 per square foot. 1989 N 2530 W is a home located in Davis County with nearby schools including West Clinton Elementary School, West Point Junior High School, and Clearfield High School.
Ownership History
Date
Name
Owned For
Owner Type
Purchase Details
Closed on
Mar 27, 2012
Sold by
Wallwork Rory
Bought by
Wallwork Rory and Barley Amanda Michelle
Current Estimated Value
Home Financials for this Owner
Home Financials are based on the most recent Mortgage that was taken out on this home.
Original Mortgage
$134,000
Outstanding Balance
$16,399
Interest Rate
3.13%
Mortgage Type
New Conventional
Estimated Equity
$487,023
Purchase Details
Closed on
Sep 10, 2004
Sold by
M & D Developers Llc
Bought by
Hansen Michael J and Hansen Natalie R
Home Financials for this Owner
Home Financials are based on the most recent Mortgage that was taken out on this home.
Original Mortgage
$131,500
Interest Rate
5.94%
Mortgage Type
Construction
Create a Home Valuation Report for This Property
The Home Valuation Report is an in-depth analysis detailing your home's value as well as a comparison with similar homes in the area
Home Values in the Area
Average Home Value in this Area
Purchase History
| Date | Buyer | Sale Price | Title Company |
|---|---|---|---|
| Wallwork Rory | -- | Us Title Company Of | |
| Wallwork Rory | -- | Bonneville Superior | |
| Hansen Michael J | -- | Heritage West Title Insuranc |
Source: Public Records
Mortgage History
| Date | Status | Borrower | Loan Amount |
|---|---|---|---|
| Open | Wallwork Rory | $134,000 | |
| Previous Owner | Hansen Michael J | $131,500 |
Source: Public Records
Tax History Compared to Growth
Tax History
| Year | Tax Paid | Tax Assessment Tax Assessment Total Assessment is a certain percentage of the fair market value that is determined by local assessors to be the total taxable value of land and additions on the property. | Land | Improvement |
|---|---|---|---|---|
| 2025 | $357 | $252,450 | $95,402 | $157,048 |
| 2024 | $333 | $243,650 | $104,335 | $139,315 |
| 2023 | $2,410 | $237,050 | $65,802 | $171,247 |
| 2022 | $2,602 | $257,400 | $72,048 | $185,352 |
| 2021 | $527 | $356,000 | $92,123 | $263,877 |
| 2020 | $2,114 | $307,000 | $79,316 | $227,684 |
| 2019 | $2,086 | $296,000 | $90,770 | $205,230 |
| 2018 | $1,922 | $268,000 | $76,421 | $191,579 |
| 2016 | $1,643 | $118,250 | $29,973 | $88,277 |
| 2015 | $1,598 | $109,395 | $29,973 | $79,422 |
| 2014 | $1,677 | $116,623 | $29,973 | $86,650 |
| 2013 | -- | $96,264 | $27,143 | $69,121 |
Source: Public Records
Map
Nearby Homes
- 2617 N 2080 W Unit 176
- Harvard Plan at Summerfield - Enclave
- 2208 W 2615 N
- Linden Plan at Summerfield - Vista
- Yale Plan at Summerfield - Enclave
- Gambel Oak Plan at Summerfield - Vista
- Cedar Plan at Summerfield - Vista
- Elm Plan at Summerfield - Vista
- Princeton Plan at Summerfield - Enclave
- Cambridge Plan at Summerfield - Enclave
- Cornell Plan at Summerfield - Enclave
- Sycamore Plan at Summerfield - Vista
- Berkeley Plan at Summerfield - Enclave
- Birch Plan at Summerfield - Vista
- Stanford Plan at Summerfield - Enclave
- 2219 N 2475 W
- 2434 W 2250 N
- 2322 N 2500 W
- 1648 N 2615 W
- 2259 W 1800 N