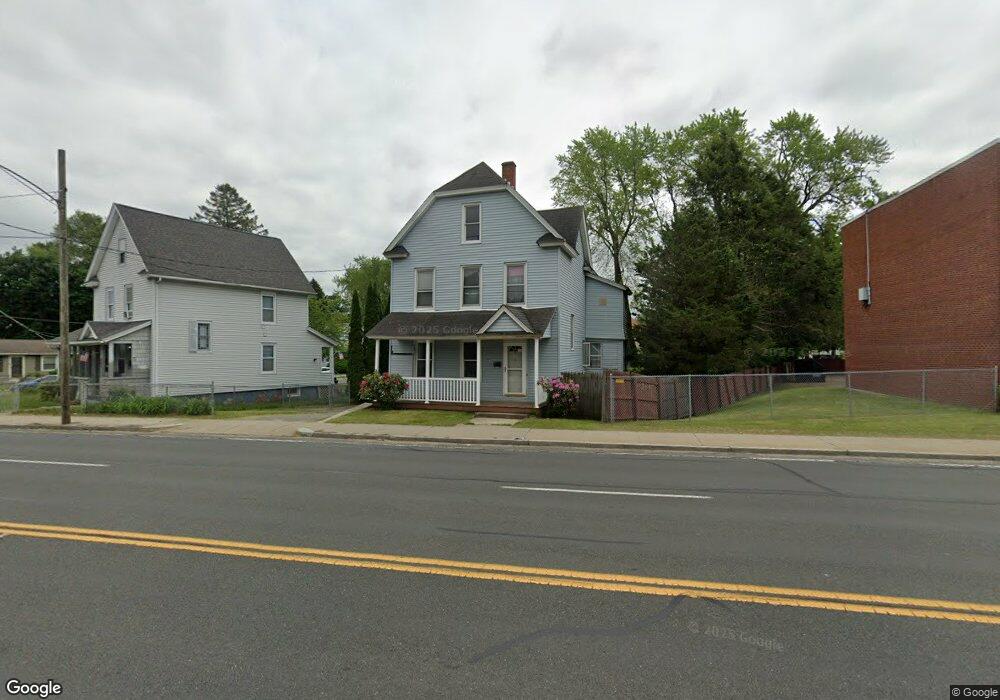
199 Boston Rd Springfield, MA 01109
Pine Point NeighborhoodEstimated Value: $262,164 - $319,000
3
Beds
2
Baths
1,488
Sq Ft
$191/Sq Ft
Est. Value
About This Home
This home is located at 199 Boston Rd, Springfield, MA 01109 and is currently estimated at $284,291, approximately $191 per square foot. 199 Boston Rd is a home located in Hampden County with nearby schools including Thomas M Balliet Elementary School, John J Duggan Middle, and Roger L. Putnam Vocational Technical Academy.
Ownership History
Date
Name
Owned For
Owner Type
Purchase Details
Closed on
Jul 9, 2012
Sold by
Tranquilli Mary L
Bought by
Tranquilli Mary L and Halama Steven S
Current Estimated Value
Purchase Details
Closed on
Jul 5, 1988
Sold by
Smith Thelma
Bought by
Tranquilli Edward E
Home Financials for this Owner
Home Financials are based on the most recent Mortgage that was taken out on this home.
Original Mortgage
$54,900
Interest Rate
10.47%
Mortgage Type
Purchase Money Mortgage
Create a Home Valuation Report for This Property
The Home Valuation Report is an in-depth analysis detailing your home's value as well as a comparison with similar homes in the area
Home Values in the Area
Average Home Value in this Area
Purchase History
| Date | Buyer | Sale Price | Title Company |
|---|---|---|---|
| Tranquilli Mary L | -- | -- | |
| Tranquilli Edward E | $74,900 | -- |
Source: Public Records
Mortgage History
| Date | Status | Borrower | Loan Amount |
|---|---|---|---|
| Previous Owner | Tranquilli Edward E | $54,900 |
Source: Public Records
Tax History
| Year | Tax Paid | Tax Assessment Tax Assessment Total Assessment is a certain percentage of the fair market value that is determined by local assessors to be the total taxable value of land and additions on the property. | Land | Improvement |
|---|---|---|---|---|
| 2025 | $1,811 | $115,500 | $39,500 | $76,000 |
| 2024 | $1,983 | $123,500 | $32,900 | $90,600 |
| 2023 | $1,724 | $101,100 | $29,900 | $71,200 |
| 2022 | $1,916 | $101,800 | $27,900 | $73,900 |
| 2021 | $1,801 | $95,300 | $25,400 | $69,900 |
| 2020 | $1,769 | $90,600 | $25,400 | $65,200 |
| 2019 | $1,687 | $85,700 | $25,400 | $60,300 |
| 2018 | $1,726 | $87,700 | $25,400 | $62,300 |
| 2017 | $1,300 | $66,100 | $23,500 | $42,600 |
| 2016 | $1,270 | $64,600 | $23,500 | $41,100 |
| 2015 | $1,420 | $72,200 | $23,500 | $48,700 |
Source: Public Records
Map
Nearby Homes
Your Personal Tour Guide
Ask me questions while you tour the home.