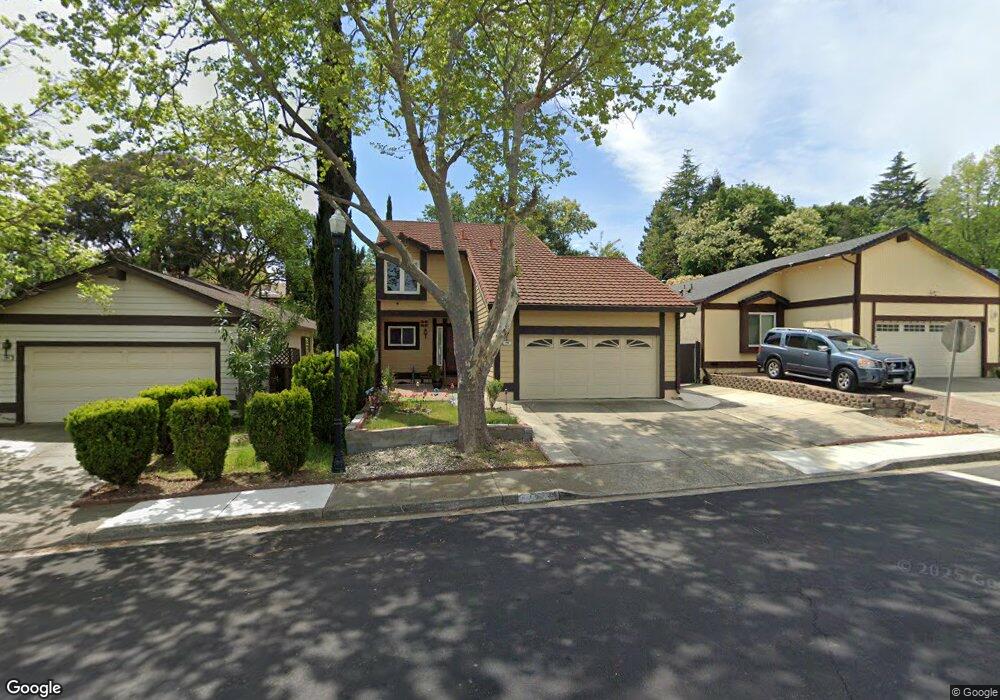
199 Brighton St Hercules, CA 94547
Foxboro NeighborhoodEstimated Value: $688,000 - $735,000
3
Beds
2
Baths
1,475
Sq Ft
$480/Sq Ft
Est. Value
About This Home
This home is located at 199 Brighton St, Hercules, CA 94547 and is currently estimated at $707,273, approximately $479 per square foot. 199 Brighton St is a home located in Contra Costa County with nearby schools including Rodeo Hills Elementary School, Carquinez Middle School, and John Swett High School.
Ownership History
Date
Name
Owned For
Owner Type
Purchase Details
Closed on
Jun 5, 2014
Sold by
Nasser Hortencia L and Nasser Rassam M
Bought by
Flores Juan Carlos and Nunez Josefina
Current Estimated Value
Home Financials for this Owner
Home Financials are based on the most recent Mortgage that was taken out on this home.
Original Mortgage
$343,660
Outstanding Balance
$261,001
Interest Rate
4.16%
Mortgage Type
FHA
Estimated Equity
$446,272
Create a Home Valuation Report for This Property
The Home Valuation Report is an in-depth analysis detailing your home's value as well as a comparison with similar homes in the area
Home Values in the Area
Average Home Value in this Area
Purchase History
| Date | Buyer | Sale Price | Title Company |
|---|---|---|---|
| Flores Juan Carlos | $350,000 | Old Republic Title Company |
Source: Public Records
Mortgage History
| Date | Status | Borrower | Loan Amount |
|---|---|---|---|
| Open | Flores Juan Carlos | $343,660 |
Source: Public Records
Tax History Compared to Growth
Tax History
| Year | Tax Paid | Tax Assessment Tax Assessment Total Assessment is a certain percentage of the fair market value that is determined by local assessors to be the total taxable value of land and additions on the property. | Land | Improvement |
|---|---|---|---|---|
| 2025 | $6,092 | $429,042 | $269,684 | $159,358 |
| 2024 | $6,144 | $420,631 | $264,397 | $156,234 |
| 2023 | $6,144 | $412,384 | $259,213 | $153,171 |
| 2022 | $6,135 | $404,299 | $254,131 | $150,168 |
| 2021 | $6,017 | $396,373 | $249,149 | $147,224 |
| 2019 | $5,880 | $384,618 | $241,760 | $142,858 |
| 2018 | $5,720 | $377,077 | $237,020 | $140,057 |
| 2017 | $5,631 | $369,684 | $232,373 | $137,311 |
| 2016 | $5,168 | $362,436 | $227,817 | $134,619 |
| 2015 | $5,116 | $356,992 | $224,395 | $132,597 |
| 2014 | $4,190 | $266,653 | $113,737 | $152,916 |
Source: Public Records
Map
Nearby Homes
- 405 Weymouth
- 996 Coral Ridge Cir
- 713 Sandy Brook Ct
- 120 Bonita Ct
- 943 Coral Ridge Cir
- 720 Seacliff Ct
- 748 Windward Dr
- 817 Ketch Ct
- 584 Silver Maple Dr
- 524 Rosewood Ln
- 890 Tradewind Ln
- 867 Hawthorne Dr
- 4 Playa Ct
- 938 Sandy Cove Dr
- 919 Elm Dr
- 943 Hawthorne Dr
- 10 Tarn Ct
- 2036 Serra Ln
- 31 Sapphire Ct
- 2054 Clark St
- 193 Brighton St
- 205 Brighton St
- 211 Brighton St
- 187 Brighton St
- 1128 Canterbury
- 1134 Canterbury
- 217 Brighton St
- 181 Brighton St
- 1122 Canterbury
- 1140 Canterbury
- 202 Brighton St
- 1116 Canterbury
- 223 Brighton St
- 175 Brighton St
- 208 Brighton St
- 190 Brighton St
- 1146 Canterbury
- 1110 Canterbury
- 214 Brighton St
- 229 Brighton St