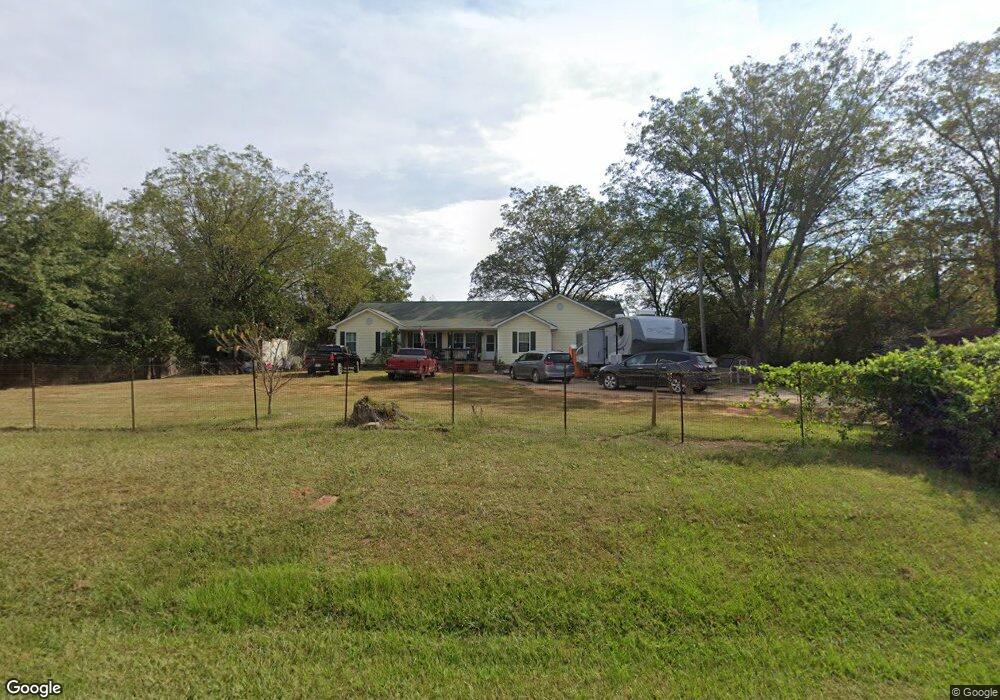
199 Burwell Rd Carrollton, GA 30117
Estimated Value: $289,000 - $407,000
5
Beds
3
Baths
2,224
Sq Ft
$157/Sq Ft
Est. Value
About This Home
This home is located at 199 Burwell Rd, Carrollton, GA 30117 and is currently estimated at $348,929, approximately $156 per square foot. 199 Burwell Rd is a home located in Carroll County with nearby schools including Bowdon Elementary School, Bowdon Middle School, and Bowdon High School.
Ownership History
Date
Name
Owned For
Owner Type
Purchase Details
Closed on
Oct 1, 2021
Sold by
Boyd Harris S
Bought by
Boyd Harris and Boyd Christopher
Current Estimated Value
Home Financials for this Owner
Home Financials are based on the most recent Mortgage that was taken out on this home.
Original Mortgage
$173,000
Outstanding Balance
$131,511
Interest Rate
2.8%
Mortgage Type
New Conventional
Estimated Equity
$217,418
Purchase Details
Closed on
Nov 19, 2003
Sold by
Gibbs Dan
Bought by
Gibbs Dan
Purchase Details
Closed on
Nov 7, 2003
Sold by
Gibbs Dan
Bought by
Boyd Harris S and Boyd Sandy F
Purchase Details
Closed on
May 3, 2002
Sold by
Gmac Mortgage Corp
Bought by
Gibbs Dan
Purchase Details
Closed on
Mar 5, 2002
Sold by
Gmac Mortgage Corp
Bought by
Federal Natl Mtg Assoc
Purchase Details
Closed on
Feb 7, 1997
Sold by
New Chuck
Bought by
Smith Horace Lee
Purchase Details
Closed on
Oct 9, 1995
Sold by
Adga Inc
Bought by
New Chuck
Purchase Details
Closed on
Aug 31, 1995
Bought by
Adga Inc
Create a Home Valuation Report for This Property
The Home Valuation Report is an in-depth analysis detailing your home's value as well as a comparison with similar homes in the area
Home Values in the Area
Average Home Value in this Area
Purchase History
| Date | Buyer | Sale Price | Title Company |
|---|---|---|---|
| Boyd Harris | -- | -- | |
| Gibbs Dan | -- | -- | |
| Boyd Harris S | $88,200 | -- | |
| Gibbs Dan | $45,000 | -- | |
| Federal Natl Mtg Assoc | -- | -- | |
| Gmac Mortgage Corp | -- | -- | |
| Smith Horace Lee | $69,900 | -- | |
| New Chuck | $38,000 | -- | |
| Adga Inc | $135,000 | -- |
Source: Public Records
Mortgage History
| Date | Status | Borrower | Loan Amount |
|---|---|---|---|
| Open | Boyd Harris | $173,000 |
Source: Public Records
Tax History Compared to Growth
Tax History
| Year | Tax Paid | Tax Assessment Tax Assessment Total Assessment is a certain percentage of the fair market value that is determined by local assessors to be the total taxable value of land and additions on the property. | Land | Improvement |
|---|---|---|---|---|
| 2024 | $2,318 | $130,128 | $3,602 | $126,526 |
| 2023 | $2,318 | $117,785 | $2,882 | $114,903 |
| 2022 | $1,895 | $94,075 | $1,921 | $92,154 |
| 2021 | $1,697 | $80,433 | $1,537 | $78,896 |
| 2020 | $1,529 | $71,022 | $1,397 | $69,625 |
| 2019 | $1,410 | $63,928 | $1,397 | $62,531 |
| 2018 | $1,244 | $53,856 | $1,397 | $52,459 |
| 2017 | $1,248 | $53,856 | $1,397 | $52,459 |
| 2016 | $1,248 | $53,856 | $1,397 | $52,459 |
| 2015 | $1,159 | $45,459 | $3,593 | $41,866 |
| 2014 | $1,164 | $45,459 | $3,593 | $41,866 |
Source: Public Records
Map
Nearby Homes
- 3680 W Highway 166
- 40 Red Holly Gap
- 21 Crabapple Place
- The Coleman Plan at Summerfield Place
- The Pearson Plan at Summerfield Place
- The Piedmont Plan at Summerfield Place
- The Harrington Plan at Summerfield Place
- The McGinnis Plan at Summerfield Place
- The Telfair Plan at Summerfield Place
- 92 Old Bowdon Rd
- 96 Old Bowdon Rd
- 33 & 67 Lambert Ln
- 95 Camp Ln
- 2070 Lovvorn Rd
- 101 Bonnie Lynn Ln
- 295 Timber Ridge Trail
- 20 Camp Ct
- 37 Cedar Dr
- 0 Wynn Rd
- 103 Red Oak Dr
- 881 Cole Rd
- 141 Burwell Rd
- 146 Burwell Rd
- 234 Burwell Rd
- 132 Burwell Rd
- 118 Burwell Rd
- 292 Burwell Rd
- 278 Burwell Rd
- 107 Burwell Rd
- 102 Burwell Rd
- 160 Burwell Rd
- 304 Burwell Rd
- 65 Burwell Rd
- 3735 W Highway 166
- 29 Burwell Rd
- 316 Burwell Rd
- 340 Burwell Rd
- 3759 W Highway 166
- 3767 W Highway 166
- 3748 W Highway 166