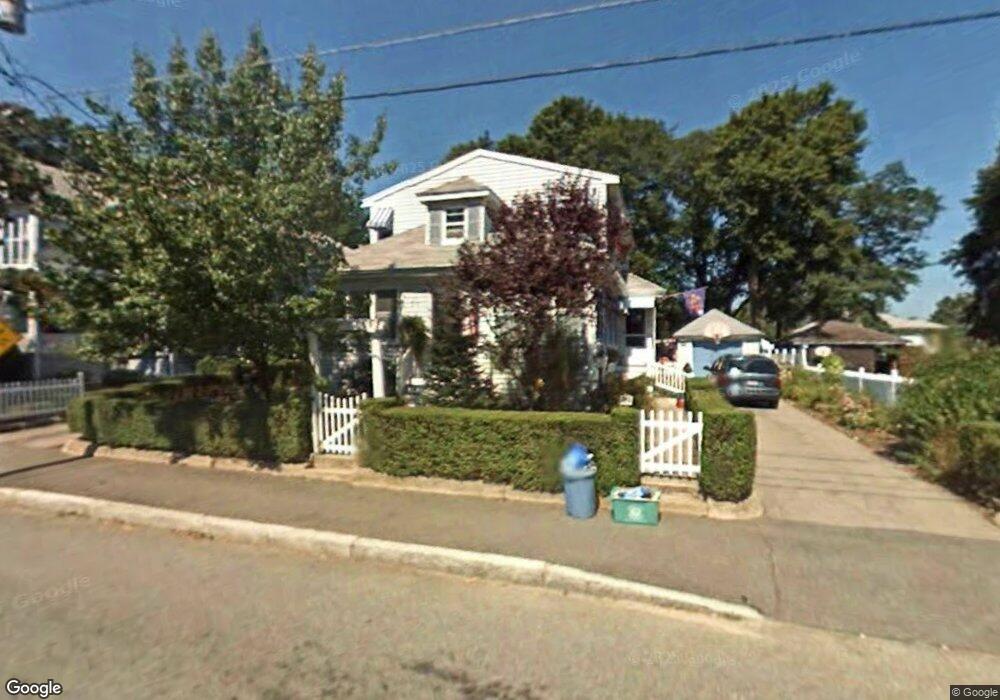
199 Dover St Brockton, MA 02301
Clifton Heights NeighborhoodEstimated Value: $472,000 - $501,000
4
Beds
3
Baths
1,736
Sq Ft
$280/Sq Ft
Est. Value
About This Home
This home is located at 199 Dover St, Brockton, MA 02301 and is currently estimated at $486,023, approximately $279 per square foot. 199 Dover St is a home located in Plymouth County with nearby schools including Manthala George Jr. School, Louis F Angelo Elementary School, and Raymond K-8 Elementary School.
Ownership History
Date
Name
Owned For
Owner Type
Purchase Details
Closed on
Jun 22, 2023
Sold by
Harriman Peter H and Harriman Joyce A
Bought by
Harriman Peter H and Harriman Joyce A
Current Estimated Value
Purchase Details
Closed on
Dec 31, 1990
Sold by
Creagh Eleanor M Est
Bought by
Harriman Peter H
Create a Home Valuation Report for This Property
The Home Valuation Report is an in-depth analysis detailing your home's value as well as a comparison with similar homes in the area
Home Values in the Area
Average Home Value in this Area
Purchase History
| Date | Buyer | Sale Price | Title Company |
|---|---|---|---|
| Harriman Peter H | -- | None Available | |
| Harriman Peter H | $96,000 | -- |
Source: Public Records
Mortgage History
| Date | Status | Borrower | Loan Amount |
|---|---|---|---|
| Previous Owner | Harriman Peter H | $47,734 | |
| Previous Owner | Harriman Peter H | $25,000 | |
| Previous Owner | Harriman Peter H | $20,000 | |
| Previous Owner | Harriman Peter H | $88,000 |
Source: Public Records
Tax History
| Year | Tax Paid | Tax Assessment Tax Assessment Total Assessment is a certain percentage of the fair market value that is determined by local assessors to be the total taxable value of land and additions on the property. | Land | Improvement |
|---|---|---|---|---|
| 2025 | $4,695 | $387,700 | $140,000 | $247,700 |
| 2024 | $4,559 | $379,300 | $140,000 | $239,300 |
| 2023 | $4,939 | $380,500 | $104,100 | $276,400 |
| 2022 | $4,718 | $337,700 | $94,600 | $243,100 |
| 2021 | $4,370 | $301,400 | $78,600 | $222,800 |
| 2020 | $3,975 | $262,400 | $73,600 | $188,800 |
| 2019 | $3,772 | $242,700 | $71,800 | $170,900 |
| 2018 | $7,139 | $212,100 | $71,800 | $140,300 |
| 2017 | $6,884 | $207,800 | $71,800 | $136,000 |
| 2016 | $3,272 | $188,500 | $69,600 | $118,900 |
| 2015 | $2,764 | $152,300 | $69,600 | $82,700 |
| 2014 | $2,729 | $150,500 | $69,600 | $80,900 |
Source: Public Records
Map
Nearby Homes
Your Personal Tour Guide
Ask me questions while you tour the home.