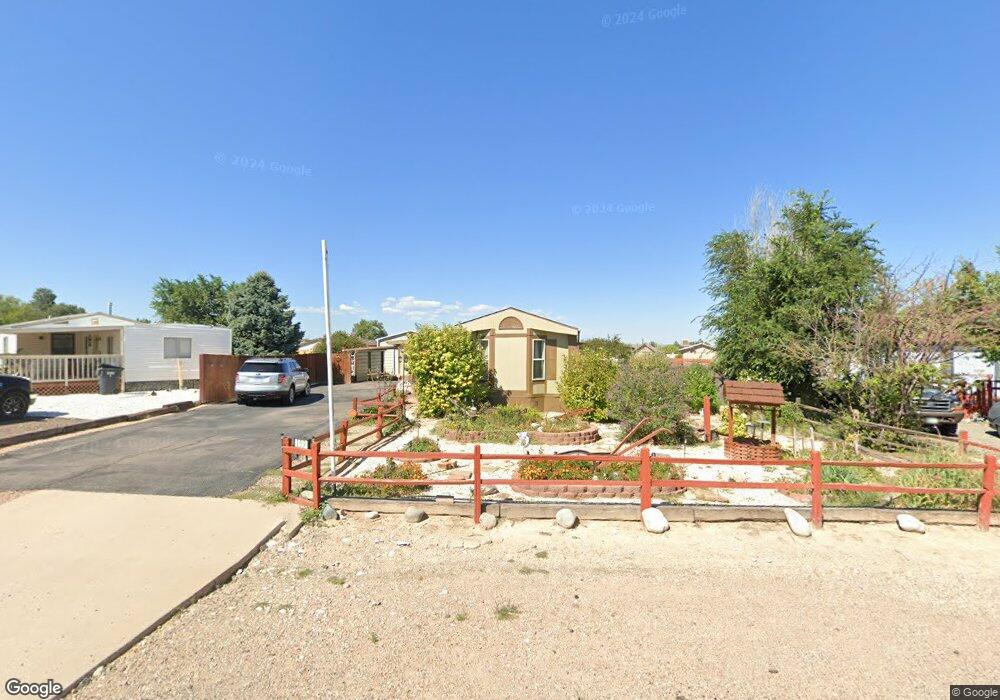
199 E Rolling Hills Dr Pueblo, CO 81007
Estimated Value: $191,000 - $263,000
3
Beds
2
Baths
1,216
Sq Ft
$188/Sq Ft
Est. Value
About This Home
This home is located at 199 E Rolling Hills Dr, Pueblo, CO 81007 and is currently estimated at $228,333, approximately $187 per square foot. 199 E Rolling Hills Dr is a home located in Pueblo County with nearby schools including Desert Sage Elementary School, Liberty Point International School, and Pueblo West High School.
Ownership History
Date
Name
Owned For
Owner Type
Purchase Details
Closed on
May 10, 2019
Sold by
Navara Joseph A and Navara Linda A
Bought by
Navara Joseph A
Current Estimated Value
Purchase Details
Closed on
Jun 26, 2007
Sold by
Green Tree Servicing Llc
Bought by
Navara Joseph A and Navara Linda A
Home Financials for this Owner
Home Financials are based on the most recent Mortgage that was taken out on this home.
Original Mortgage
$34,459
Interest Rate
6.37%
Mortgage Type
FHA
Purchase Details
Closed on
Jan 26, 2007
Sold by
Zitkus Wayne E and Zitkus Sandra W
Bought by
Green Tree Servicing Llc
Purchase Details
Closed on
Jul 13, 1998
Sold by
Millerd Max A + Dorothy J
Bought by
Zitkus W E + S W W and Zitkus Millerd M
Purchase Details
Closed on
Apr 5, 1982
Sold by
Lawyers Title Of Pueblo Tr
Bought by
Millerd Max A + Dorothy J
Create a Home Valuation Report for This Property
The Home Valuation Report is an in-depth analysis detailing your home's value as well as a comparison with similar homes in the area
Home Values in the Area
Average Home Value in this Area
Purchase History
We collect this data history from publicly available records. To have your information removed, we recommend requesting removal directly through your county’s website.
| Date | Buyer | Sale Price | Title Company |
|---|---|---|---|
| Navara Joseph A | $58,000 | Land Title Guarantee Co | |
| Navara Joseph A | $35,000 | Land Title Guarantee Company | |
| Green Tree Servicing Llc | -- | None Available | |
| Zitkus W E + S W W | $15,000 | -- | |
| Millerd Max A + Dorothy J | -- | -- |
Source: Public Records
Mortgage History
We collect this data history from publicly available records. To have your information removed, we recommend requesting removal directly through your county’s website.
| Date | Status | Borrower | Loan Amount |
|---|---|---|---|
| Previous Owner | Navara Joseph A | $34,459 |
Source: Public Records
Tax History
| Year | Tax Paid | Tax Assessment Tax Assessment Total Assessment is a certain percentage of the fair market value that is determined by local assessors to be the total taxable value of land and additions on the property. | Land | Improvement |
|---|---|---|---|---|
| 2025 | $1,416 | $13,380 | -- | -- |
| 2024 | $946 | $9,400 | -- | -- |
| 2023 | $957 | $13,080 | $1,840 | $11,240 |
| 2022 | $916 | $9,130 | $1,910 | $7,220 |
| 2021 | $940 | $9,400 | $1,970 | $7,430 |
| 2020 | $780 | $9,400 | $1,970 | $7,430 |
| 2019 | $393 | $7,772 | $965 | $6,807 |
| 2018 | $303 | $5,979 | $972 | $5,007 |
| 2017 | $599 | $5,979 | $972 | $5,007 |
| 2016 | $513 | $5,138 | $1,075 | $4,063 |
| 2015 | $509 | $5,138 | $1,075 | $4,063 |
| 2014 | $472 | $4,763 | $1,075 | $3,688 |
Source: Public Records
Map
Nearby Homes
- 186 E Rolling Hills Dr
- 232 E Rolling Hills Dr
- 990 S Silt Dr
- 1033 S Saddlerock Dr
- 219 E Linden Ave
- 183 E Birch Hills Dr
- 1024 S Greenbrier Dr
- 1002 S Sibley Dr
- 972 S Saddlerock Dr
- 98 E Countryside Dr
- 972 S Dante Dr
- 105 E Cellini Dr
- 366 E Greenway Dr
- 890 S Cellini Plaza
- 113 E Homer Dr
- 1069 S Limestone Ln Unit 14
- 181 E Kipling Dr
- 279 E Kipling Dr
- 360 E Byrd Dr
- 1086 S Briarcliff Dr
- 207 E Rolling Hills Dr
- 187 E Rolling Hills Dr
- 215 E Rolling Hills Dr
- 184 E Dawnview Dr
- 206 E Rolling Hills Dr
- 200 E Dawnview Dr Unit 8
- 200 E Dawnview Dr
- 168 E Dawnview Dr
- 214 E Rolling Hills Dr
- 223 E Rolling Hills Dr Unit 31
- 223 E Rolling Hills Dr
- 198 E Rolling Hills Dr
- 1050 S Saddlerock Dr
- 216 E Dawnview Dr
- 56 E Rolling Hills Dr Unit 16
- 160 E Dawnview Dr
- 160 E Dawnview Dr Unit 1
- 226 E Rolling Hills Dr
- 174 E Rolling Hills Dr
- 239 E Rolling Hills Dr
Your Personal Tour Guide
Ask me questions while you tour the home.