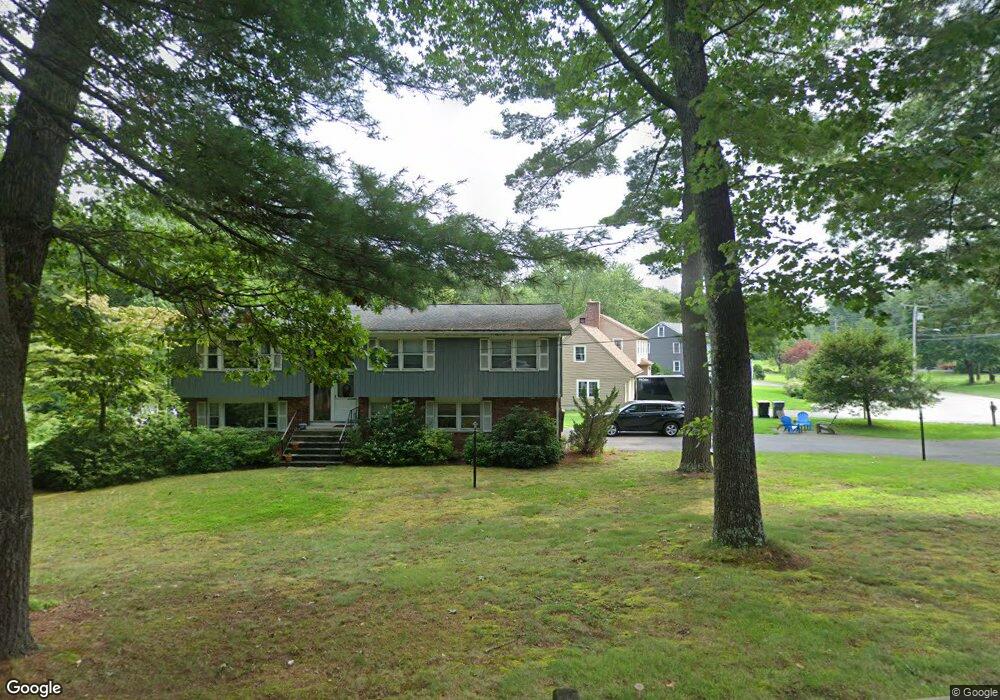
199 Hemenway Rd Unit 1 Framingham, MA 01701
Nobscot NeighborhoodEstimated Value: $781,000 - $903,000
4
Beds
3
Baths
2,215
Sq Ft
$374/Sq Ft
Est. Value
About This Home
This home is located at 199 Hemenway Rd Unit 1, Framingham, MA 01701 and is currently estimated at $828,975, approximately $374 per square foot. 199 Hemenway Rd Unit 1 is a home located in Middlesex County with nearby schools including Framingham High School and MetroWest Jewish Day School.
Ownership History
Date
Name
Owned For
Owner Type
Purchase Details
Closed on
May 1, 2009
Sold by
Robertson Silvana E
Bought by
Spencer-Dees Karen and Dees Jeffrey L
Current Estimated Value
Home Financials for this Owner
Home Financials are based on the most recent Mortgage that was taken out on this home.
Original Mortgage
$368,182
Outstanding Balance
$230,742
Interest Rate
4.86%
Mortgage Type
Purchase Money Mortgage
Estimated Equity
$598,233
Purchase Details
Closed on
Jan 26, 2005
Sold by
Robertson Alton K and Robertson Silvana E
Bought by
Robertson Silvana E
Home Financials for this Owner
Home Financials are based on the most recent Mortgage that was taken out on this home.
Original Mortgage
$269,500
Interest Rate
5.67%
Mortgage Type
Purchase Money Mortgage
Purchase Details
Closed on
Dec 31, 1997
Sold by
Bessert Clementina R
Bought by
Robertson Alton K and Robertson Silvana E
Create a Home Valuation Report for This Property
The Home Valuation Report is an in-depth analysis detailing your home's value as well as a comparison with similar homes in the area
Home Values in the Area
Average Home Value in this Area
Purchase History
| Date | Buyer | Sale Price | Title Company |
|---|---|---|---|
| Spencer-Dees Karen | $375,000 | -- | |
| Spencer-Dees Karen | $375,000 | -- | |
| Robertson Silvana E | -- | -- | |
| Robertson Silvana E | -- | -- | |
| Robertson Silvana E | -- | -- | |
| Robertson Alton K | $205,000 | -- | |
| Robertson Alton K | $205,000 | -- |
Source: Public Records
Mortgage History
| Date | Status | Borrower | Loan Amount |
|---|---|---|---|
| Open | Spencer-Dees Karen | $368,182 | |
| Closed | Robertson Alton K | $368,182 | |
| Previous Owner | Robertson Silvana E | $269,500 |
Source: Public Records
Tax History Compared to Growth
Tax History
| Year | Tax Paid | Tax Assessment Tax Assessment Total Assessment is a certain percentage of the fair market value that is determined by local assessors to be the total taxable value of land and additions on the property. | Land | Improvement |
|---|---|---|---|---|
| 2025 | $8,651 | $724,500 | $274,200 | $450,300 |
| 2024 | $8,100 | $650,100 | $244,900 | $405,200 |
| 2023 | $7,720 | $589,800 | $218,600 | $371,200 |
| 2022 | $7,377 | $536,900 | $198,300 | $338,600 |
| 2021 | $7,284 | $518,400 | $190,600 | $327,800 |
| 2020 | $7,346 | $490,400 | $173,200 | $317,200 |
| 2019 | $7,325 | $476,300 | $173,200 | $303,100 |
| 2018 | $7,222 | $442,500 | $166,800 | $275,700 |
| 2017 | $6,960 | $416,500 | $161,900 | $254,600 |
| 2016 | $6,764 | $389,200 | $161,900 | $227,300 |
| 2015 | $6,834 | $383,500 | $162,200 | $221,300 |
Source: Public Records
Map
Nearby Homes
- 91 Eaton Rd W
- 14 Eisenhower Rd
- 19 Nob Hill Dr
- 32 Eaton Rd W
- 27 Sloane Dr
- 30 Nobscot Rd Unit 14
- 84 Hopestill Brown Rd
- 41 James St
- 128 Nobscot Rd
- 40 Gregory Rd
- 106 Baldwin Ave
- 78 Apple d or Rd
- 53 Davidson Rd
- 0 Wagonwheel Rd
- 30 Edith Rd
- 1011 Boston Post Rd
- 63 Landham Rd
- 50 Juniper Ln
- 24 Woodland Rd
- 14 Francine Rd