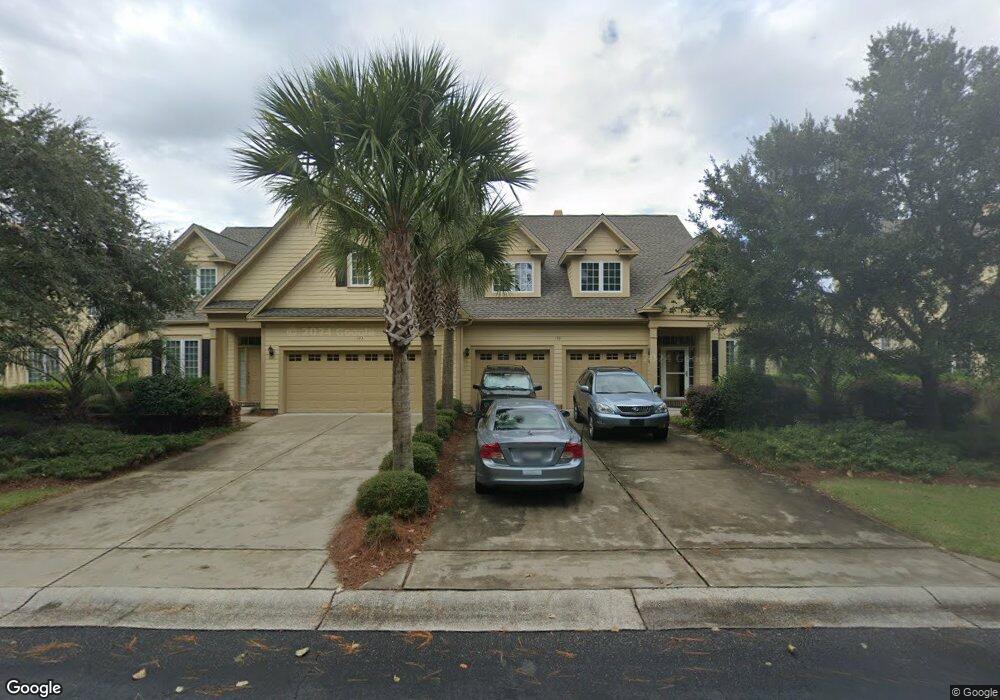
199 Huntington Lake Cir Unit 116 Pawleys Island, SC 29585
Estimated Value: $704,434 - $847,000
3
Beds
4
Baths
3,000
Sq Ft
$261/Sq Ft
Est. Value
About This Home
This home is located at 199 Huntington Lake Cir Unit 116, Pawleys Island, SC 29585 and is currently estimated at $783,609, approximately $261 per square foot. 199 Huntington Lake Cir Unit 116 is a home located in Georgetown County with nearby schools including Waccamaw Elementary School, Waccamaw Intermediate School, and Waccamaw Middle School.
Ownership History
Date
Name
Owned For
Owner Type
Purchase Details
Closed on
Mar 31, 2011
Sold by
Holt Alma Pauline and Provenzano Kay C
Bought by
Nelson Nancy K
Current Estimated Value
Home Financials for this Owner
Home Financials are based on the most recent Mortgage that was taken out on this home.
Original Mortgage
$290,000
Outstanding Balance
$201,193
Interest Rate
4.92%
Mortgage Type
New Conventional
Estimated Equity
$582,416
Purchase Details
Closed on
Apr 14, 2010
Sold by
Holt Alma Pauline
Bought by
Holt Alma Pauline and Provenzano Kay C
Purchase Details
Closed on
Nov 13, 2008
Sold by
Litchfield Residential At Huntington Lak
Bought by
Holt Alma Pauline and King Glenna L
Home Financials for this Owner
Home Financials are based on the most recent Mortgage that was taken out on this home.
Original Mortgage
$325,000
Interest Rate
6.11%
Mortgage Type
Credit Line Revolving
Create a Home Valuation Report for This Property
The Home Valuation Report is an in-depth analysis detailing your home's value as well as a comparison with similar homes in the area
Home Values in the Area
Average Home Value in this Area
Purchase History
| Date | Buyer | Sale Price | Title Company |
|---|---|---|---|
| Nelson Nancy K | $395,000 | -- | |
| Holt Alma Pauline | -- | -- | |
| Holt Alma Pauline | $539,900 | -- |
Source: Public Records
Mortgage History
| Date | Status | Borrower | Loan Amount |
|---|---|---|---|
| Open | Nelson Nancy K | $290,000 | |
| Previous Owner | Holt Alma Pauline | $325,000 |
Source: Public Records
Tax History Compared to Growth
Tax History
| Year | Tax Paid | Tax Assessment Tax Assessment Total Assessment is a certain percentage of the fair market value that is determined by local assessors to be the total taxable value of land and additions on the property. | Land | Improvement |
|---|---|---|---|---|
| 2024 | $1,992 | $15,600 | $0 | $15,600 |
| 2023 | $1,992 | $15,600 | $0 | $15,600 |
| 2022 | $1,829 | $15,600 | $0 | $15,600 |
| 2021 | $1,769 | $15,600 | $0 | $15,600 |
| 2020 | $1,765 | $15,600 | $0 | $15,600 |
| 2019 | $1,704 | $15,200 | $0 | $15,200 |
| 2018 | $1,740 | $152,000 | $0 | $0 |
| 2017 | $1,573 | $152,000 | $0 | $0 |
| 2016 | $1,635 | $16,000 | $0 | $0 |
| 2015 | $1,525 | $0 | $0 | $0 |
| 2014 | $1,525 | $385,000 | $0 | $385,000 |
| 2012 | -- | $385,000 | $0 | $385,000 |
Source: Public Records
Map
Nearby Homes
- 285 Huntington Lake Cir Unit A
- 12 Courtyard Cir Unit 36
- 130 Preservation Cir
- 874 Preservation Cir
- lot 63 Preservation Cir
- 95 Harbor Club Dr Unit 3A
- 44 Hamby Dr
- 528 Preservation Cir
- 334 Brickwell Ln
- Lot 37 County Road S-22-362
- Lot 56 County Road S-22-362
- 1259 Oatland Lake Rd
- 40 Winston Cir
- 41 Federation Loop Unit Reunion Hall
- 77 Tern Place Unit 202
- 356 Chapman Loop
- 423 Chapman Loop
- 1692 Tradition Club Dr
- 164 Boatmen Dr
- 82 Mingo Dr Unit 3-B
- 193 Huntington Lake Cir
- 209 Huntington Lake Cir Unit 114
- 215 Huntington Lake Cir Unit 112
- 167 Huntington Lake Cir Unit 122F
- 177 Huntington Lake Cir Unit 120
- 229 Huntington Lake Cir
- 141 Huntington Lake Cir
- 269 Huntington Lake Cir Unit The Reserve
- 269 Huntington Lake Cir
- 269 Huntington Lake Cir Unit 104
- 253 Huntington Lake Cir
- 106 Huntington Lake Cir Unit 98
- 99 Huntington Lake Cir
- Lot 82 Huntington Mews E
- Lot 5 Huntington Mews E
- Lot 5 E Huntington Mews
- Lot 24 Huntington Mews W
- Lot 3 Huntington Mews
- Lot 13 Huntington Mews E
- 297 Huntington Lake Cir