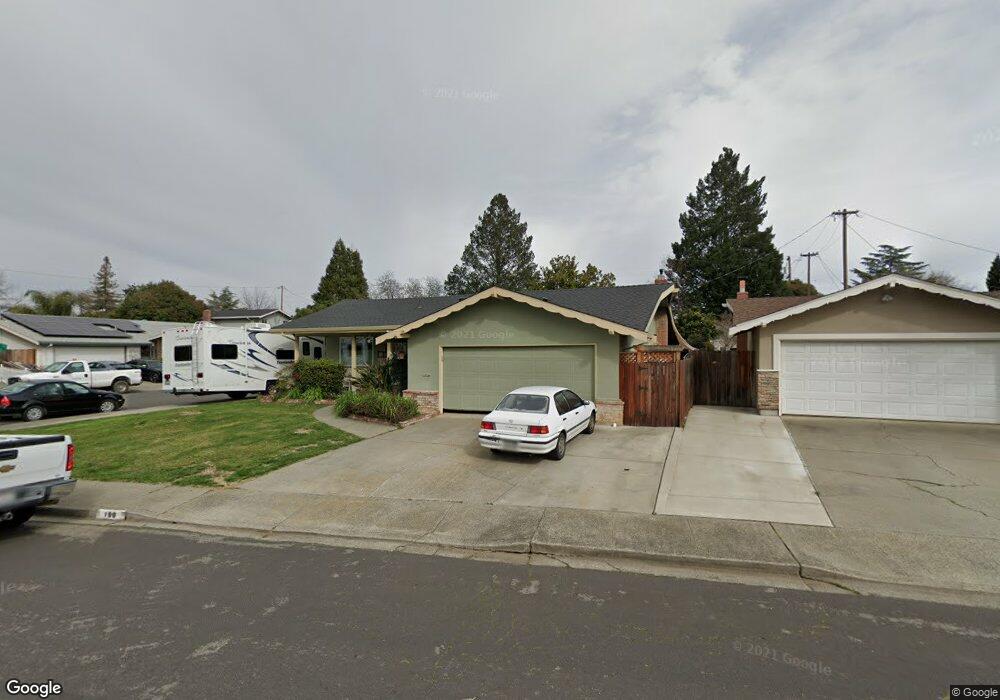
199 Jepson Way Vacaville, CA 95688
Estimated Value: $536,000 - $566,000
3
Beds
2
Baths
1,372
Sq Ft
$397/Sq Ft
Est. Value
About This Home
This home is located at 199 Jepson Way, Vacaville, CA 95688 and is currently estimated at $544,347, approximately $396 per square foot. 199 Jepson Way is a home located in Solano County with nearby schools including Hemlock Elementary School, Orchard Elementary School, and Willis Jepson Middle School.
Ownership History
Date
Name
Owned For
Owner Type
Purchase Details
Closed on
Jun 23, 1999
Sold by
Braun Jason B
Bought by
Whittaker Kevin D and Ariza Brenda G
Current Estimated Value
Home Financials for this Owner
Home Financials are based on the most recent Mortgage that was taken out on this home.
Original Mortgage
$126,156
Outstanding Balance
$33,683
Interest Rate
7.2%
Estimated Equity
$510,664
Purchase Details
Closed on
May 6, 1999
Sold by
Martin Louis L
Bought by
Braun Jason B
Home Financials for this Owner
Home Financials are based on the most recent Mortgage that was taken out on this home.
Original Mortgage
$126,156
Outstanding Balance
$33,683
Interest Rate
7.2%
Estimated Equity
$510,664
Purchase Details
Closed on
Apr 25, 1997
Sold by
Braun Jason B
Bought by
Braun Jason B and Martin Louis L
Home Financials for this Owner
Home Financials are based on the most recent Mortgage that was taken out on this home.
Original Mortgage
$107,250
Interest Rate
8.99%
Create a Home Valuation Report for This Property
The Home Valuation Report is an in-depth analysis detailing your home's value as well as a comparison with similar homes in the area
Home Values in the Area
Average Home Value in this Area
Purchase History
| Date | Buyer | Sale Price | Title Company |
|---|---|---|---|
| Whittaker Kevin D | $127,000 | Frontier Title Company | |
| Braun Jason B | -- | -- | |
| Braun Jason B | $67,500 | Placer Title Company |
Source: Public Records
Mortgage History
| Date | Status | Borrower | Loan Amount |
|---|---|---|---|
| Open | Whittaker Kevin D | $126,156 | |
| Previous Owner | Braun Jason B | $107,250 |
Source: Public Records
Tax History Compared to Growth
Tax History
| Year | Tax Paid | Tax Assessment Tax Assessment Total Assessment is a certain percentage of the fair market value that is determined by local assessors to be the total taxable value of land and additions on the property. | Land | Improvement |
|---|---|---|---|---|
| 2025 | $2,412 | $216,281 | $53,784 | $162,497 |
| 2024 | $2,412 | $212,041 | $52,730 | $159,311 |
| 2023 | $2,354 | $207,885 | $51,697 | $156,188 |
| 2022 | $2,291 | $203,810 | $50,686 | $153,124 |
| 2021 | $2,294 | $199,815 | $49,693 | $150,122 |
| 2020 | $2,262 | $197,767 | $49,184 | $148,583 |
| 2019 | $2,222 | $193,890 | $48,220 | $145,670 |
| 2018 | $2,196 | $190,089 | $47,275 | $142,814 |
| 2017 | $2,121 | $186,363 | $46,349 | $140,014 |
| 2016 | $2,103 | $182,710 | $45,441 | $137,269 |
| 2015 | $2,075 | $179,967 | $44,759 | $135,208 |
| 2014 | $1,943 | $176,443 | $43,883 | $132,560 |
Source: Public Records
Map
Nearby Homes
- 179 N Alamo Dr
- 507 Buckeye St
- 185 Salinas Dr
- 172 Salinas Dr
- 107 Foothill Dr
- 910 Linwood St
- 136 Suisun Ct
- 434 Cottonwood St
- 173 San Jose Ct
- 700 Shady Glen Rd Unit 42
- 591 Arlene Dr
- 118 Salinas Dr
- 287 N Alamo Dr
- 567 Parkridge Dr
- 100 Pima Ct
- 365 Acacia St
- 491 Buck Ave
- 179 Wykoff Dr
- 124 Wykoff Dr
- 584 Fruitvale Rd