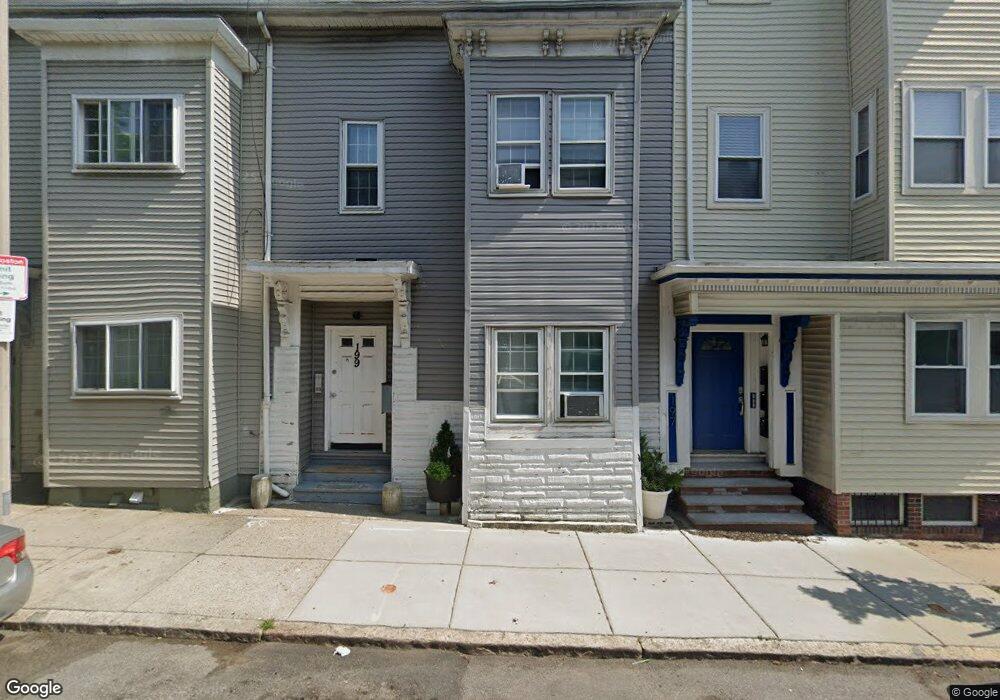
199 Lexington St Boston, MA 02128
Eagle Hill NeighborhoodEstimated Value: $907,000 - $1,013,000
5
Beds
4
Baths
2,268
Sq Ft
$420/Sq Ft
Est. Value
About This Home
This home is located at 199 Lexington St, Boston, MA 02128 and is currently estimated at $952,000, approximately $419 per square foot. 199 Lexington St is a home located in Suffolk County with nearby schools including Excel Academy East Boston and East Boston Central Catholic School.
Ownership History
Date
Name
Owned For
Owner Type
Purchase Details
Closed on
Oct 10, 2008
Sold by
Guerra Ana S
Bought by
Guerra Chevarria Ana S and Rodriques Oscar R
Current Estimated Value
Purchase Details
Closed on
Mar 24, 2006
Sold by
Caballero Emerita B and Caballero Wilberto
Bought by
Chavarria Ana S G
Home Financials for this Owner
Home Financials are based on the most recent Mortgage that was taken out on this home.
Original Mortgage
$413,250
Interest Rate
6.28%
Mortgage Type
Purchase Money Mortgage
Purchase Details
Closed on
Nov 1, 2000
Sold by
Haselton Peter
Bought by
Caballero Wilberto and Caballero Emerita
Purchase Details
Closed on
Mar 6, 1989
Sold by
Realty T Inc 100
Bought by
Haseltonn Peter
Purchase Details
Closed on
Feb 17, 1989
Sold by
Malden T Co
Bought by
100 Rlty T Inc
Purchase Details
Closed on
Jul 1, 1987
Sold by
Daly Paul
Bought by
Piazza David M
Create a Home Valuation Report for This Property
The Home Valuation Report is an in-depth analysis detailing your home's value as well as a comparison with similar homes in the area
Home Values in the Area
Average Home Value in this Area
Purchase History
| Date | Buyer | Sale Price | Title Company |
|---|---|---|---|
| Guerra Chevarria Ana S | -- | -- | |
| Chavarria Ana S G | $435,000 | -- | |
| Caballero Wilberto | $240,000 | -- | |
| Haseltonn Peter | $900,000 | -- | |
| 100 Rlty T Inc | $85,000 | -- | |
| Piazza David M | $135,000 | -- |
Source: Public Records
Mortgage History
| Date | Status | Borrower | Loan Amount |
|---|---|---|---|
| Previous Owner | Chavarria Ana S G | $413,250 | |
| Previous Owner | Piazza David M | $247,000 | |
| Previous Owner | Piazza David M | $240,000 |
Source: Public Records
Tax History Compared to Growth
Tax History
| Year | Tax Paid | Tax Assessment Tax Assessment Total Assessment is a certain percentage of the fair market value that is determined by local assessors to be the total taxable value of land and additions on the property. | Land | Improvement |
|---|---|---|---|---|
| 2025 | $9,448 | $815,900 | $197,500 | $618,400 |
| 2024 | $8,768 | $804,400 | $199,100 | $605,300 |
| 2023 | $8,552 | $796,300 | $197,100 | $599,200 |
| 2022 | $7,948 | $730,500 | $180,800 | $549,700 |
| 2021 | $7,794 | $730,500 | $180,800 | $549,700 |
| 2020 | $6,416 | $607,600 | $201,500 | $406,100 |
| 2019 | $5,718 | $542,500 | $121,400 | $421,100 |
| 2018 | $5,075 | $484,300 | $121,400 | $362,900 |
| 2017 | $4,458 | $421,000 | $121,400 | $299,600 |
| 2016 | $4,027 | $366,100 | $121,400 | $244,700 |
| 2015 | $3,324 | $274,500 | $83,800 | $190,700 |
| 2014 | $3,003 | $238,700 | $83,800 | $154,900 |
Source: Public Records
Map
Nearby Homes
- 107 Putnam St Unit 3
- 215 Lexington St
- 125 Putnam St
- 167 Lexington St Unit 1
- 167 Lexington St Unit 167
- 147 Trenton St Unit 3
- 301 Saratoga St Unit 2
- 157 Princeton St Unit 1
- 118 White St
- 123 Trenton St Unit 3
- 223 Saratoga St Unit 203
- 219 Saratoga St Unit 2
- 219 Saratoga St Unit PH-S
- 1 Prescott St Unit 304
- 221 Trenton St
- 233 Bennington St
- 160 Putnam St
- 116 Brooks St
- 403-405 Saratoga St
- 326 Chelsea St Unit 3
- 201 Lexington St
- 197 Lexington St
- 197 Lexington St Unit 1
- 197 Lexington St Unit 2
- 203 Lexington St
- 203 Lexington St Unit A
- 203 Lexington St Unit 3
- 203 Lexington St Unit 1
- 106 Putnam St
- 104 Putnam St Unit 104A
- 205-207 Lexington St
- 205 Lexington St Unit 207
- 205 Lexington St
- 205 Lexington St Unit 1
- 205 Lexington St Unit 2
- 108 Putnam St
- 108 Putnam St Unit 2
- 108 Putnam St Unit 1
- 108 Putnam St Unit 3
- 209-211 Lexington St