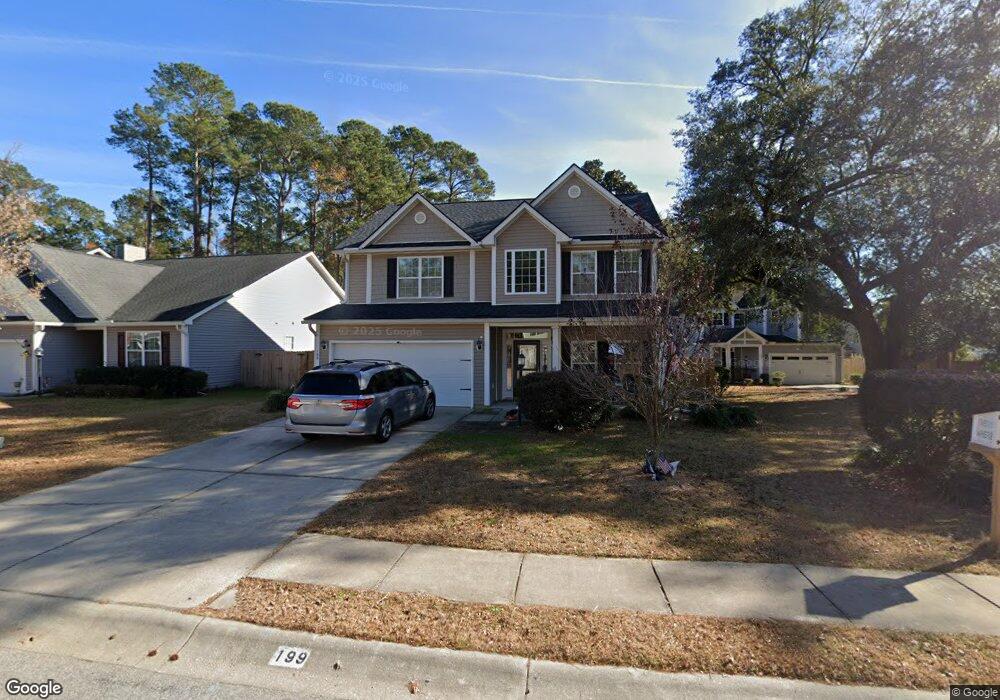
199 Withers Ln Ladson, SC 29456
Estimated Value: $378,495 - $410,000
4
Beds
3
Baths
2,261
Sq Ft
$174/Sq Ft
Est. Value
About This Home
This home is located at 199 Withers Ln, Ladson, SC 29456 and is currently estimated at $393,874, approximately $174 per square foot. 199 Withers Ln is a home located in Dorchester County with nearby schools including Dr. Eugene Sires Elementary, Oakbrook Middle School, and Ashley Ridge High School.
Ownership History
Date
Name
Owned For
Owner Type
Purchase Details
Closed on
Nov 4, 2016
Sold by
Henry Kevin L and Henry Roxanne L
Bought by
Henry Kevin L and Henry Roxanne L
Current Estimated Value
Home Financials for this Owner
Home Financials are based on the most recent Mortgage that was taken out on this home.
Original Mortgage
$230,000
Outstanding Balance
$184,738
Interest Rate
3.52%
Mortgage Type
VA
Estimated Equity
$209,136
Purchase Details
Closed on
Jul 30, 2013
Sold by
Crescent Homes Sc Llc
Bought by
Henry Kevin and Henry Roxanne L
Home Financials for this Owner
Home Financials are based on the most recent Mortgage that was taken out on this home.
Original Mortgage
$224,161
Interest Rate
3.96%
Mortgage Type
VA
Purchase Details
Closed on
Jan 6, 2012
Sold by
Three Pines Developers Llc
Bought by
Crescent Homes Sc Llc
Create a Home Valuation Report for This Property
The Home Valuation Report is an in-depth analysis detailing your home's value as well as a comparison with similar homes in the area
Home Values in the Area
Average Home Value in this Area
Purchase History
| Date | Buyer | Sale Price | Title Company |
|---|---|---|---|
| Henry Kevin L | -- | Lawyers Title | |
| Henry Kevin | $217,000 | -- | |
| Crescent Homes Sc Llc | $105,000 | -- |
Source: Public Records
Mortgage History
| Date | Status | Borrower | Loan Amount |
|---|---|---|---|
| Open | Henry Kevin L | $230,000 | |
| Closed | Henry Kevin | $224,161 |
Source: Public Records
Tax History
| Year | Tax Paid | Tax Assessment Tax Assessment Total Assessment is a certain percentage of the fair market value that is determined by local assessors to be the total taxable value of land and additions on the property. | Land | Improvement |
|---|---|---|---|---|
| 2025 | $357 | $14,414 | $3,800 | $10,614 |
| 2024 | $357 | $14,414 | $3,800 | $10,614 |
| 2023 | $357 | $9,270 | $1,800 | $7,470 |
| 2022 | $181 | $9,270 | $1,800 | $7,470 |
| 2021 | $327 | $9,270 | $1,800 | $7,470 |
| 2020 | $264 | $8,680 | $1,400 | $7,280 |
| 2019 | $264 | $8,680 | $1,400 | $7,280 |
| 2018 | $1,938 | $8,680 | $1,400 | $7,280 |
| 2017 | $1,899 | $8,680 | $1,400 | $7,280 |
| 2016 | $1,881 | $8,680 | $1,400 | $7,280 |
| 2015 | $1,883 | $8,680 | $1,400 | $7,280 |
| 2014 | $1,848 | $197,566 | $0 | $0 |
| 2013 | -- | $1,400 | $0 | $0 |
Source: Public Records
Map
Nearby Homes
- 9875 Jamison Rd
- 224 Withers Ln
- 206 Limehouse Dr
- 111 MacFarren Ln
- 117 Alwyn Blvd
- 111 Jarett Rd
- 198 Two Pond Loop
- 120 Two Pond Loop
- 181 Two Pond Loop
- 217 Beverly Dr
- 1225 Maryland Dr
- 100 Pewter Ln
- 9658 Jamison Rd
- 113 Mapperton Ct
- 9622 Stockport Cir
- 202 Elliott Dr
- 117 Savannah River Dr
- 215 Breckingridge Dr
- 9711 Stockport Cir
- 558 Wynfield Forest Dr
- 201 Withers Ln
- 197 Withers Ln
- 203 Withers Ln
- 195 Withers Ln
- 193 Withers Ln
- 211 Withers Ln
- 215 Withers Ln
- 198 Withers Ln
- 196 Withers Ln
- 194 Withers Ln
- 217 Withers Ln
- 202 Withers Ln
- 200 Withers Ln
- 191 Withers Ln
- 192 Withers Ln
- 219 Withers Ln
- 204 Withers Ln
- 190 Withers Ln
- 189 Withers Ln
- 0 Miles Jamison Rd Unit 2906297
Your Personal Tour Guide
Ask me questions while you tour the home.